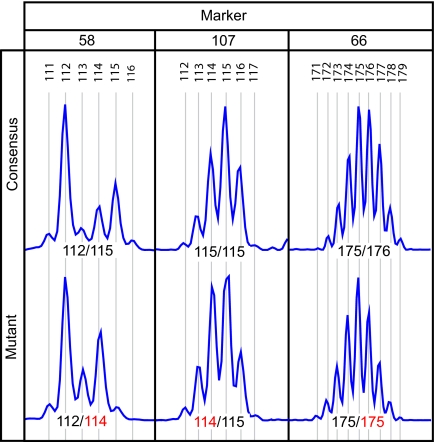
Fig. 1.
Example electropherograms showing polyguanine tract genotype variation between a spatially separated pair of UC colon biopsies in three individuals. For each polyguanine marker, the “consensus” genotype is that most commonly observed among biopsies from a single patient. Mutant genotypes are those that differ from the consensus with respect to the length of at least one allele. X-axis indicates product length (bp), y-axis represents signal intensity. Allele lengths are indicated, with mutant alleles in red. Non-indicated peaks are an artifact of PCR amplification (“stutter”).

