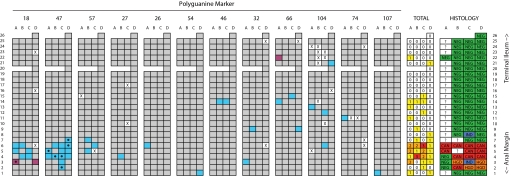
Fig. 4.
Polyguanine mapping of a complete UC Progressor colon. A longitudinally opened colectomy specimen is diagramed with boxes representing evenly spaced biopsies measuring ≈9 mm2 within an alphanumeric grid. The histological diagnosis of each biopsy is indicated at far right: NEG, negative for dysplasia; IND, indefinite dysplasia; HGD, high grade dysplasia; CAN, cancer; ?, no data. Biopsy genotypes for various polyguanine marker are indicated in separate grids. “X” indicates unsuccessful genotyping. Gray fields indicate biopsies with the consensus genotype for the marker, and different colors represent distinct mutant genotypes for each marker. Dots indicate biopsies where a mixture of consensus and mutant genotypes were observed, suggesting a mixed population of cells with different genotypes. The total number of mutant genotypes identified across all markers is reported for each biopsy (heat map). Large, clonally derived patches identified by three markers were observed near the cancer site. Numerous smaller patches were detected throughout the nondysplastic portions of the colon.

