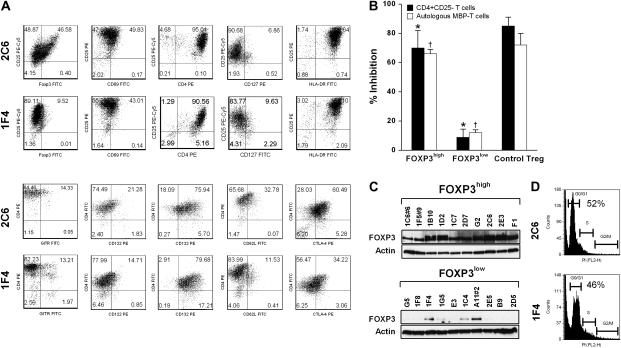
Fig. 1.
Characterization of MBP83–99-specific pro-inflammatory and Tregs. MBP83–99-specific T-cell clones were established from the peripheral blood of patients with MS. Before the experiments, cells were cultured for at least 5 days after the last stimulation with soluble anti-CD3 (2 μg ml−1) and anti-CD28 (1 μg ml−1) antibodies. (A) Two representative MBP83–99-specific T-cell clones (clone 2C6 and clone 1F4) were characterized by flow cytometric analysis for the indicated cell surface markers and FOXP3 expression. (B) Suppressive functions of FOXP3high MBP83–99-specific T-cell clones. Ten clones per group were selected from all FOXP3high and FOXP3low clones. They were analyzed for anti-proliferation properties using CD4+CD25− T cells and a selected autologous FOXP3low MBP-specific T-cell clone as responder cells. The ratio of responder to inhibitor was 1:1. Purified CD4+CD25+ natural Treg cells were used as a control. Data are presented as mean ± SD from all the clones tested. A Student's t-test was used to statistically analyze the difference between the comparable inhibition groups (asterisks indicate comparable groups in the inhibition of CD4+CD25− responder T cells; daggers indicate comparable groups in the inhibition of autologous MBP-reactive responder T cells). The P value of t-test is <0.05. The experiments for control Treg were performed independently three times. The error bar for control Treg indicates the SD of inter-experimental mean. (C) Western blot analysis of FOXP3 expression was performed for 20 selected T-cell clones representing FOXP3high and FOXP3low subsets of MBP83–99-specific T cells. (D) Cell cycle was analyzed using PI staining for clone 2C6 and clone 1F4 at the same the time point of culture as assayed in (A). The percent of cells in G0/G1 phase is indicated.

