Fig. 4.
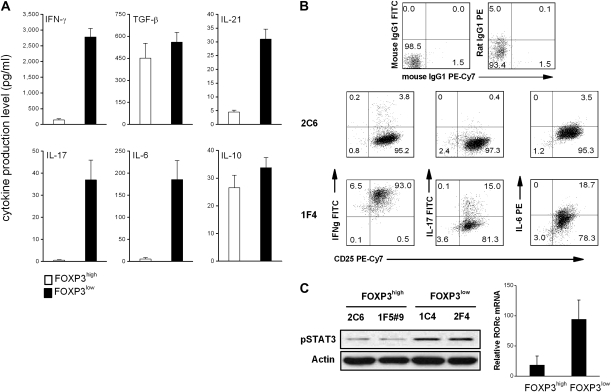
Cytokine production and level of pSTAT3 and RORc in FOXP3high and FOXP3low MBP83–99-specific T cells. (A) Culture supernatants of MBP83–99-specific T-cell clones (FOXP3high clones n = 10, FOXP3low clones n = 12) were harvested 3 days after initial antigen stimulation and measured by ELISA for the production of cytokines. (B) Clones 2C6 and 1F4 were stimulated with 50 ng ml−1 of phorbol myristate acetate and 1 μg ml−1 of calcium ionophore for 5 h in the presence of GolgiStop and subsequently harvested for intracellular cytokine analysis by flow cytometry. (C) Cells were collected from the culture of clones 2C6, 1F4, 1C4 and 1F5#9. Phosphorylated STAT3 was examined by western blot and mRNA level of RORc was measured by real-time PCR.

