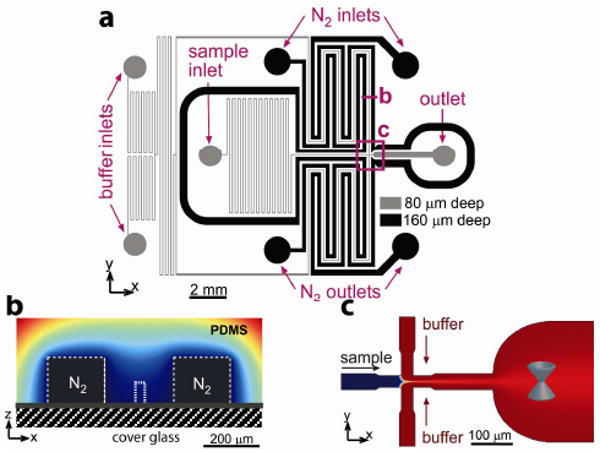
Figure 1.

(a) Schematic of the microfluidic device. Channels for sample solution and buffers (grey), and for nitrogen (black). (b) Cross sectional view of a flow channel flanked by two nitrogen channels, with color-coded concentration of oxygen in PDMS. (c) 2D focusing and interrogation channel. Blue cone indicates measurement point.
