
Figure 2.
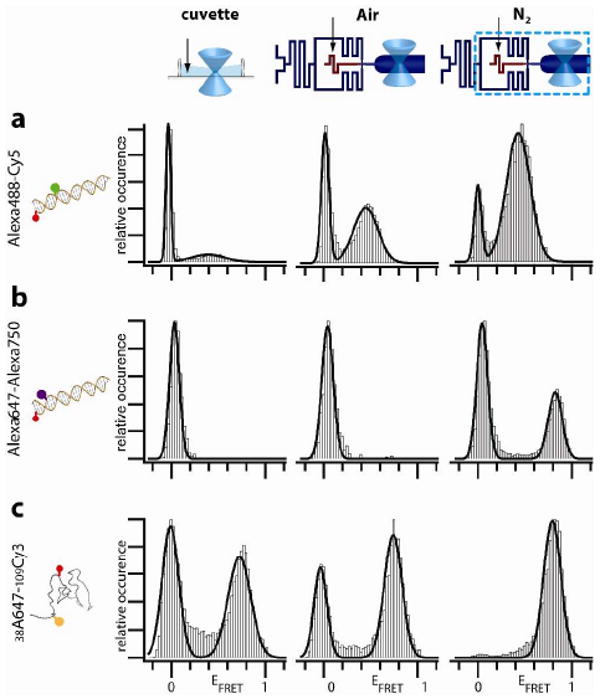
EFRET histograms of dual-labeled samples measured in a cuvette (left panels), in the microfluidic device with ambient air (middle panels) or N2 (right panels) flowing through the gas channels. (a) DNA labeled with Alexa488-Cy5. (b) DNA labeled with the near-IR dye pair Alexa647-Alexa750. (c) T4Lysozyme labeled with Cy3 and Alexa647.