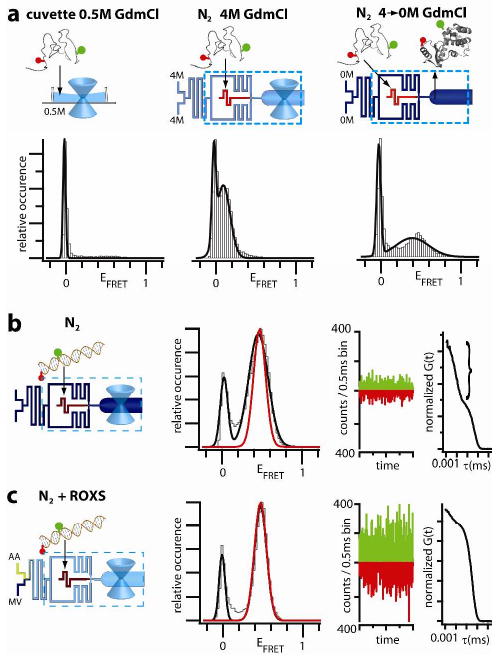
Figure 3.

(a) T4Lysozyme dual-labeled with Alexa488-Cy5 measured in a cuvette in 0.5M GdmCl (left) and in the device with N2 flow in 4M GdmCl buffer (middle) and after the buffer is exchanged to 0M GdmCl, which induces folding (right). (b,c) DNA labeled with Alexa488-Alexa647 measured in the device with N2 and N2 plus ROXS. EFRET histograms (left panels; fit to the N2+ROXS peak overlayed in red), real time traces of photon counts per 0.5 ms (middle panels), and FCS curves (right panels, triplet component in bracket) are shown.
