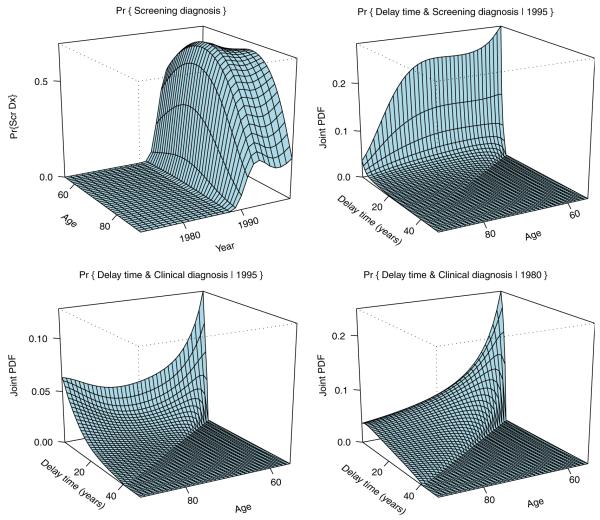
Figure 3.
Distribution (23) of the mixing vector derived from the marginal incidence model. Top left: marginal distribution of the mode of detection Iscr; probability of screening diagnosis. Top right: crude distribution of delay time AD for disease diagnosed by screening in year 1995. Bottom left: same as top right for clinical diagnoses in year 1995. Bottom right: same as bottom left in year 1980. Note the shift of probability mass toward smaller delay times with the introduction of screening, particularly for screen-detected cancers.

