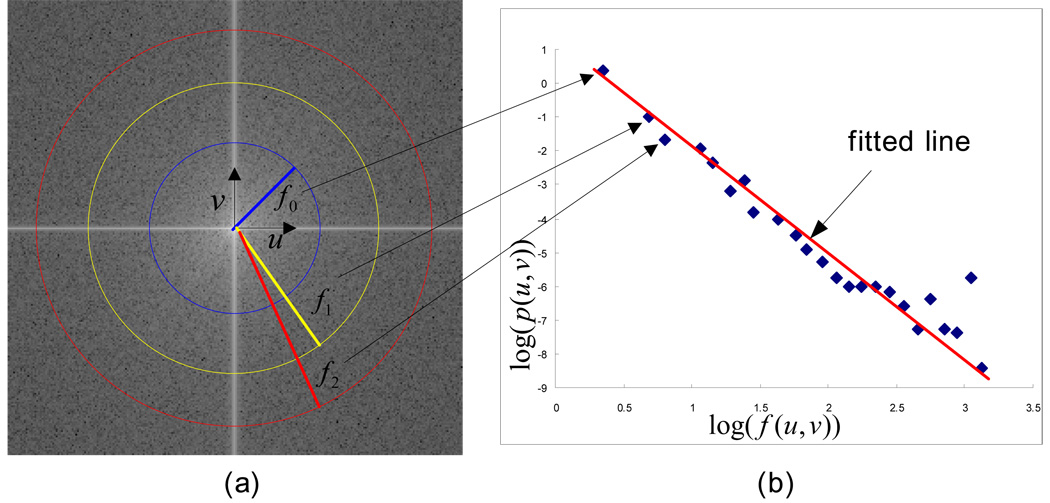
Figure 1.
(a) Power spectrum using Fourier transform and (b) the line fitting for the curve on average log(P(u,v)) versus log(f (u,v)) . The center of the image is the origin of the frequency coordinate system. f0 , f1 , and f2 are the distance according to frequencies, u and v, from origin of the coordinate system.

