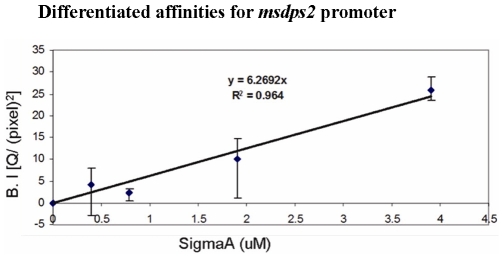
Figure 6. Standard calibration curve using known molar concentrations of pure σA protein from M. tuberculosis.
The band intensity (B.I) in Y axis represents the relative intensities of the western blots obtained with different concentrations of M. tuberculosis σA. In silico analysis was carried out with the Fujifilm Multi-Gauge software. All experiments were performed in triplicates and the average value was taken.

