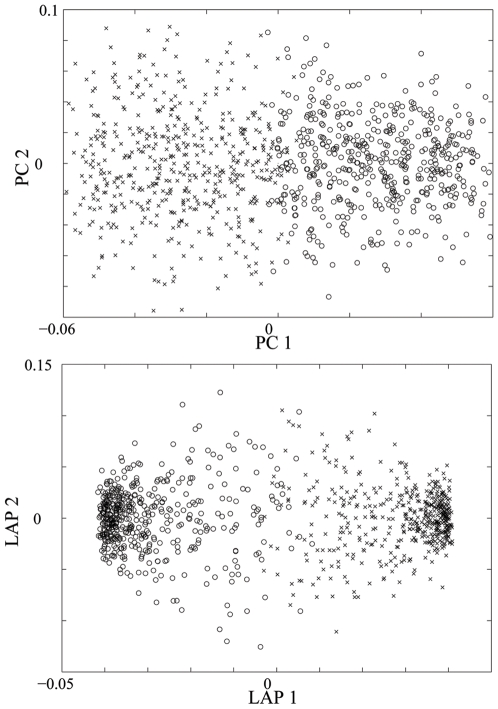
Figure 2. Structure of a simulated admixed population.
The ancestral population structure detected by PCA (top) and by Laplacian with  (bottom), for the admixed population with two ancestral populations, where crosses (circles) stand for individuals whose ancestry proportion from ancestral population 1 is larger (smaller) than one-half.

