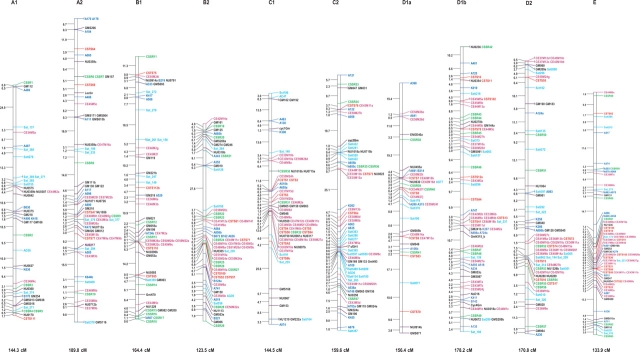
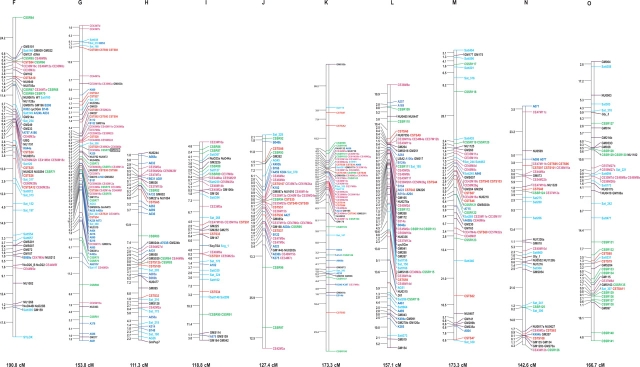
Figure 3.
Soybean genetic linkage map constructed with RFLP, SSR, STS, and AFLP markers. The linkage map was graphically visualized with MapChart. The name of each LG is indicated on the top of the bar. Distances between markers are indicated on the left side of each LG, as calculated by the Kosambi function. Total length of each LG is also indicated at the bottom of each group. Different colors represent the following markers: Violet red, AFLP; Red, CSTS; Green, CSSR; Light sky blue, SSR (Public); Dark blue, RFLP; Black, RFLP (Public); Italic Black, Phenotypic marker; Boxed Black, RAPD marker.


