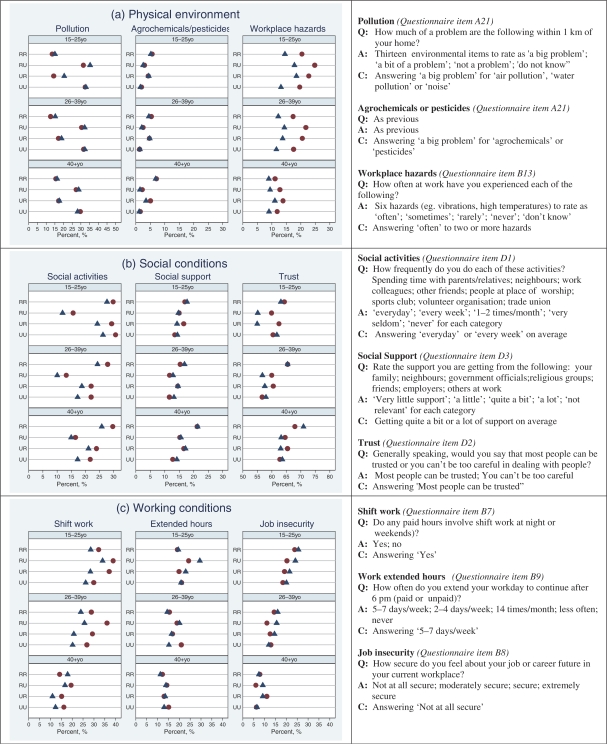
Fig. 2. .
Mid-level environmental determinants.
Graphs show the percent of males (•) and females (▲) by level of urbanisation† and age group in the 2005 Thai cohort of 86,008 university students. Text shows wording of the questions (Q), answers available (A) and the criterion producing the binary variable (C).
†RR = lived in rural area when 10–12yo and in 2005; RU = rural when 10–12yo, urban in 2005; UR = urban 10–12yo, rural 2005; UU = urban 10–12yo and 2005.

