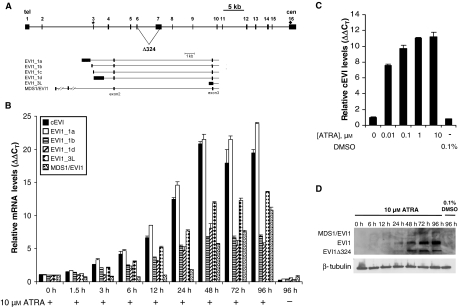
Fig. 1.
Induction of different EVI1 mRNA and protein variants in response to ATRA in NTERA-2 cells. (A) Schematic of the human EVI1 gene and its mRNA splice and 5′-end variants. Boxes, exons; lines, introns. The upper panel shows the entire EVI1 gene, with alternative splicing producing the Δ324 mRNA variant indicated by triangular lines. Asterisk and diamond, positions of the start codon in exon 3 and of the stop codon in exon 16, respectively. In the lower panel, only the 5′-end of the gene with several alternative first exons is shown. The alternative first exon contained within EVI1_1a is exon 1a, etc. Reproduced with permission from [1]. (B) NTERA-2 cells were treated with 10 μm ATRA or an equivalent amount of dimethylsulfoxide for the indicated periods of time. RNA was extracted and reverse transcribed, and the mRNA levels of cEVI1 (i.e. the sum of all EVI1 transcripts, amplified using forward and reverse primers located in exons 7 and 8/9, respectively; black columns), EVI1_1a (white columns), EVI1_1b (horizontally striped columns), EVI1_1d (diagonally striped columns), EVI1_3L (checked columns) and MDS1/EVI1 (stippled columns) were assayed by RTQ-RT-PCR. The expression of each EVI1 mRNA variant relative to the housekeeping gene cyclophilinD and the 0 h time point, as well as standard deviations between replicate measurements, were calculated using the ΔΔCT method [45]. Please note that because the ΔΔCT method relates expression values to the 0 h time point for each amplicon, only induction factors, but not expression levels, can be compared between different amplicons. (C) NTERA-2 cells were treated with the indicated amounts of ATRA or dimethylsulfoxide for 15 h. RTQ-RT-PCR for cEVI1 was performed as described above. (D) NTERA-2 cells were treated with 10 μm ATRA or an equivalent amount of dimethylsulfoxide for the indicated periods of time. Proteins were extracted and subjected to immunoblot analysis using an antibody against EVI1, or a β-tubulin antibody as a loading control. The EVI1 antibody detected three bands whose molecular masses corresponded to those of MDS1/EVI1 (∼ 170 kDa), EVI1 (∼ 140 kDa) and of the protein product of an internal splice variant of EVI1, Δ324 (∼ 100 kDa).

