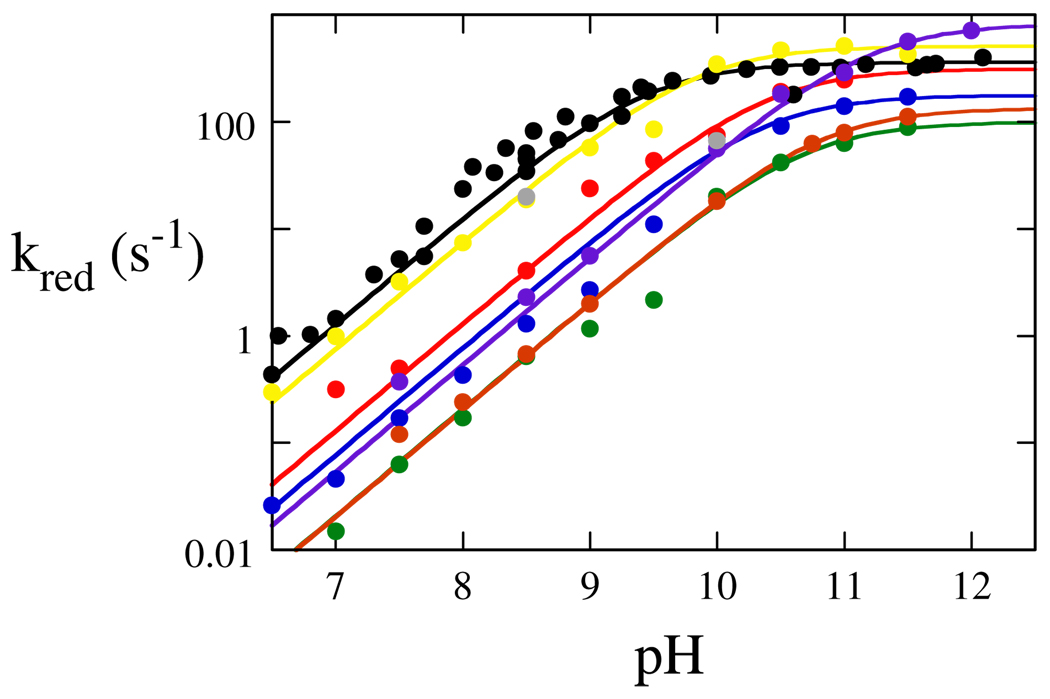
Figure 5.
pH Dependence of Reduction Rate Constants. Wild-type, black; Thr178Ser, yellow; Thr178Ala, blue; Thr178Val, green; Phe115Ala, red; Phe115Leu, purple; Phe115Trp, grey; Phe115Leu/Thr178Val, orange. The limiting reduction rate constants and observed pKa values can be found in Table 3.

