
Table 4.
Predicted and observed Ki values for hiCE with 5 fluorene analogues (compounds 56–60) that were postulated from the QSAR analyses to be excellent CE inhibitors.
| ID | Structure | clogP | Pred Ki 3 (nM) | Exp Ki 3 (± SE, nM) | Pred Ki 1 (nM) | Exp Ki 1 (± SE, nM) | hCE1 Ki 3 (± SE, nM) |
|---|---|---|---|---|---|---|---|
| 56 | 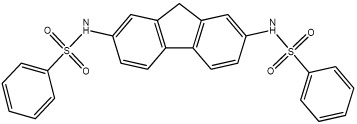 |
4.83 | 98.4 (Train) | 90.8 ± 1.1 | 1,820 | 84.7 ± 14.0 | >100,000 |
| 57 | 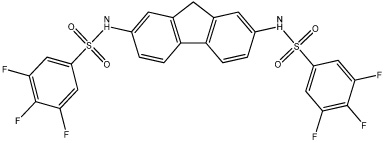 |
4.10 | 7.9 | 18.6 ± 5.3 | 9,350 | 58.1 ± 12.3 | >100,000 |
| 58 | 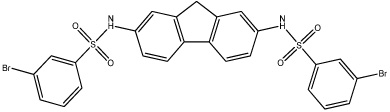 |
5.69 | 570 | 21.2 ± 2.5 | 72.8 | 39.7 ± 7.9 | >100,000 |
| 59 | 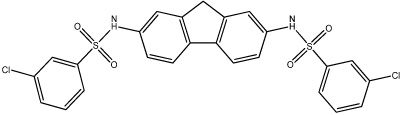 |
5.52 | 100 | 13.9 ± 2.5 | 9,780 | 52.8 ± 20.7 | >100,000 |
| 60 | 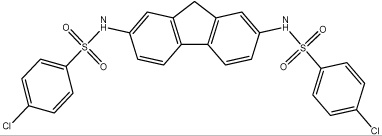 |
5.55 | 25.2 (Train) | 23.5 ± 5.7 | 3,930 | 37.7 ± 7.0 | >100,000 |