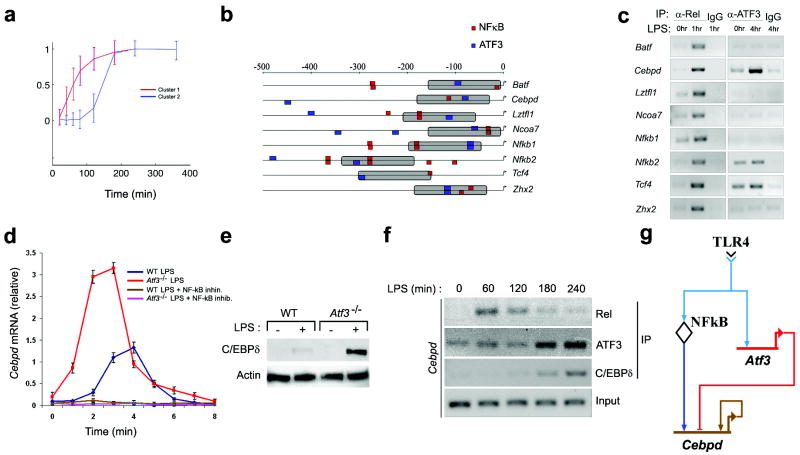
Figure 1. Prediction and validation of LPS-induced transcription factor network involving NF-κB, C/EBPδ and ATF3.
a, Macrophages from wild-type mice were stimulated with 10 ng/ml LPS for the indicated times. mRNA was isolated and subjected to microarray analysis. A total of 78 TFs were detected in cluster 1 (red line) and cluster 2 (blue line) kinetic clusters. Shown are normalized log fold-change gene expression data over time. Each profile shows the cluster-average expression for a single cluster over 6 h after LPS-stimulation. Data represent the average of three independent experiments.
b, ATF3 and NF-κB binding sites were identified in the cis-regulatory regions of transcription factor genes (cluster 2). Predicted targets were filtered using the additional constraint of a 150bp proximity limit (gray bars) between putative ATF3 and NF-κB binding sites.
c, Macrophages from wild-type mice were stimulated with 10ng/ml LPS, for the indicated time periods. Nuclear Rel and ATF3 were immunoprecipitated and the indicated genes were amplified by via PCR from transcription factor-bound DNA. IgG immunoprecipitates, negative control. Data are representative of two independent experiments.
d, WT and Atf3-/- macrophages were stimulated with 10 ng/ml LPS in the presence or absence of the NF-κB inhibitor sc-514 (25μM) for the indicated times. Data represent the average of three independent experimental values ± standard error.
e, Macrophages from wild-type and Atf3-/- mice were stimulated with 10ng/ml LPS. Cells were harvested 4 h after LPS stimulation and the lysates were subjected to immunoblotting with the indicated antibodies. Actin, loading control. Data are representative of three independent experiments.
f, Macrophages from wild-type mice were stimulated with 10 ng/ml LPS for the indicated times. Kinetics of Rel, C/EBPδ, and ATF3 recruitment to the Cebpd promoter were assayed by ChIP followed by PCR amplification, as in c. Data are representative of three independent experiments.
g, Transcriptional factor transcriptional network model depicted as a BioTapestry diagram36.

