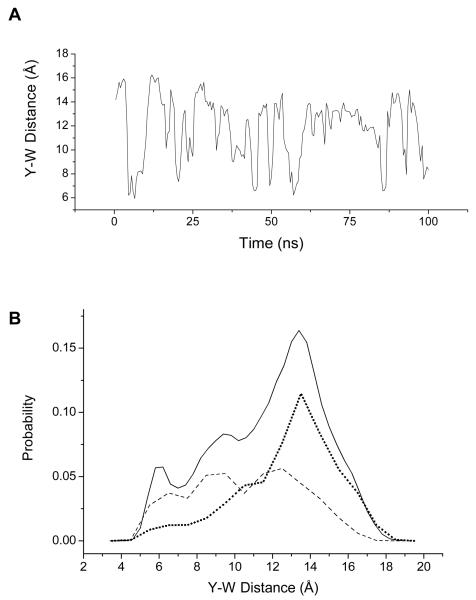
Figure 8.
A. Trajectory of Tyr-Trp distances from MD simulation of YGGWL. The distances were averaged over 500 ps. (See text for details of the simulation.) B. Distribution of Tyr-Trp distances from the MD simulation in 500-ps blocked averages. The solid line shows the total distribution (0.2 Å bins). The dashed line is the distance distribution for the t rotamer of Tyr (0.5 Å bins) and the dotted line is the distance distribution for the g− rotamer of Tyr (0.5 Å bins).

