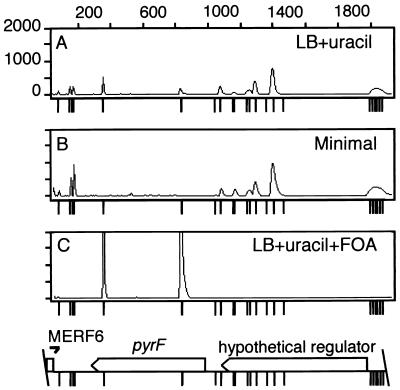
Figure 1.
Genetic footprinting at the pyrF locus. Locations of transposon insertions at the pyrF region were mapped by PCR with a fluorescent-labeled transposon-specific primer, MarOUT, and a chromosomal primer, MERF6. genescan software quantifies the DNA fragments and displays the results as an electropherogram that shows fluorescence intensity (y axis) as a function of time, which corresponds to the molecular weight of the PCR products (x axis). PCR analysis of the pyrF locus from transposon insertion mutants isolated under three selective conditions: LB plates containing Ura (A), minimal plates (B), and LB plates containing Ura and FOA (C). Tick marks below each electropherogram and the corresponding genomic map of the pyrF region indicate the position of the TA dinucleotides. The two peaks within pyrF are off scale (C), because they are ≈4-fold more intense than the next largest peak seen in A and B.

