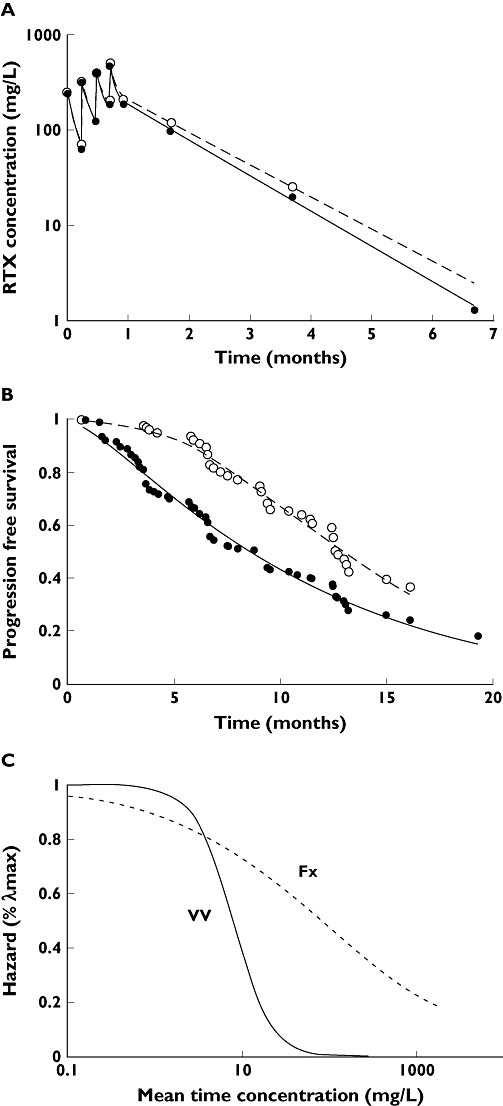
Figure 2.

Results of model building for median rituximab concentrations (A) and progression-free survival (PFS) (B). For all patients, observations are displayed as closed and open circles for all patients and responders, respectively. Predictions are displayed as solid and dashed lines for all patients and responders, respectively. (C) Reduction of λmaxvs. mean-time concentration. VV and Fx patients are displayed as solid and dashed lines, respectively
