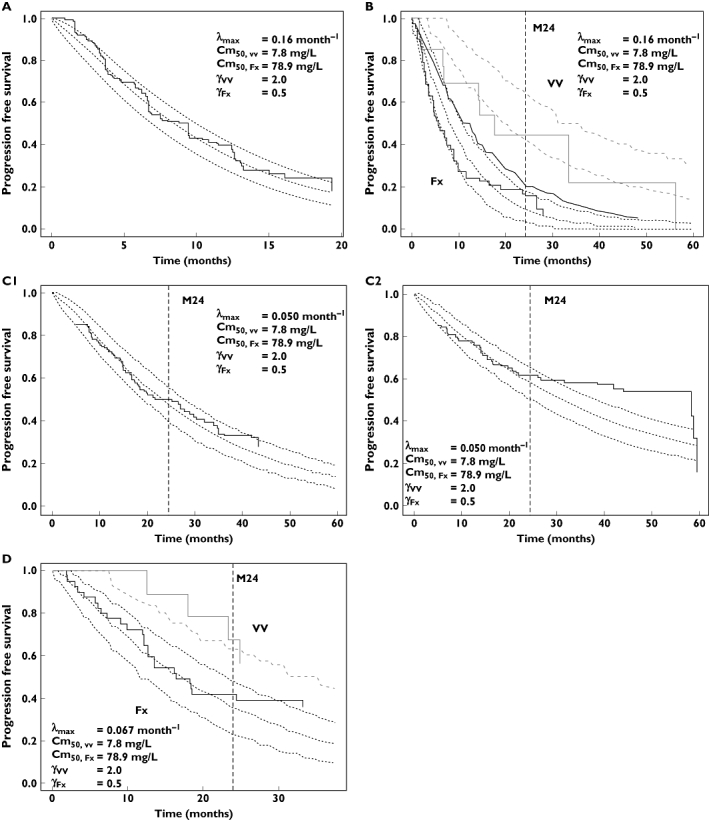
Figure 3.

Visual predictive checks of studies A, B, C and D. Visual predictive checks of study A (A), study B (B), study C which compared rituximab, cyclophosphamide, vincristine, adriamycin and prednisone (R-CHOP) without maintenance (C1) and R-CHOP with maintenance (C2), and study D (D). The solid lines are observed progression-free survival (PFS) and the dashed lines are 5th, 50th and 95th percentiles of predicted PFS. The 5th and 95th percentiles determine the 90% confidence interval (CI). In study B and D, the PFS of Fx and VV patients are displayed as black and grey lines, respectively. The value of PFS at 24 months (vertical dashed lines) is given in Table 3. In Figure 3D, the confidence interval for VV patients is too large to be represented
