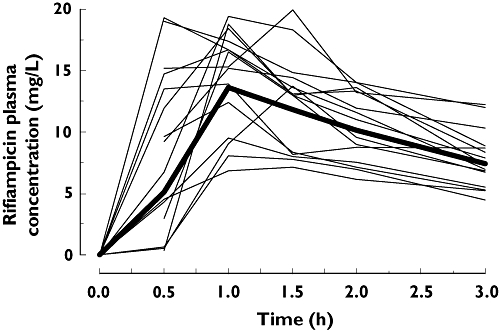
Figure 2.

Plasma concentration levels of rifampicin on day 12 after the administration of 600 mg rifampicin once daily for 7 days (from day 5 to day 12). Shown are the geometric mean (Geo Mean) and the individual levels of the healthy male subjects (n= 16). Geometric Mean shown as ( )
)
