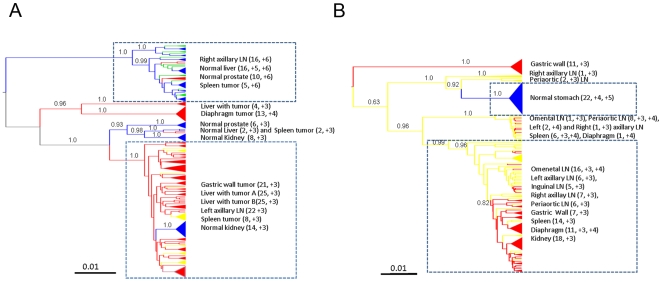
Figure 2. Phylogenetic analysis HIV-1 gp120 sequences from different tissues.
Bayesian maximum clade credibility trees assuming a relaxed molecular clock and constant population size coalescent prior generated from the posterior distribution of trees less a 50% burn-in. Branch lengths are shown according to the scale bar at the bottom of each panel, in relative units of time (nucleotide substitutions per site). Posterior probabilities for major nodes are indicated. Internal branches are colored according to the maximum parsimony reconstruction of the ancestral tissue of origin: red = tumor; yellow or green = lymph node; blue = normal tissue. Posterior probability values>80% are shown along the branches. The tissues of origin found within major clades are listed to the right with LN indicating lymph nodes. Number of sequences and V3 loop net charge within the clade for each tissue are given in parentheses. A. Subject AM. Yellow and green lineages represent viral strains from right and left axillary lymph nodes, respectively. B. Subject IV.

