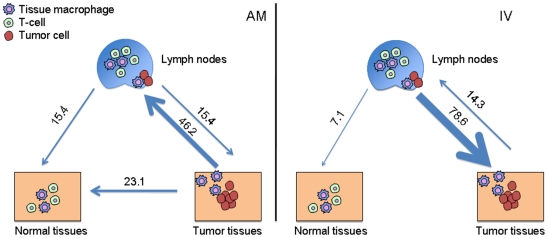
Figure 4. Viral gene flow analysis among different.
Light blue arrows represent HIV-1 gene flow from/to normal tissues, tumor tissues and lymph nodes. Viral gene flow among different tissues was inferred with a modified version of the Slatkin and Maddison method13,28 from the HIV-1 genealogies including strains from different tissues. Numbers on the arrows represent percentage of observed migration in the genealogies. Left panel. Subject AM. Right panel. Subject IV.

