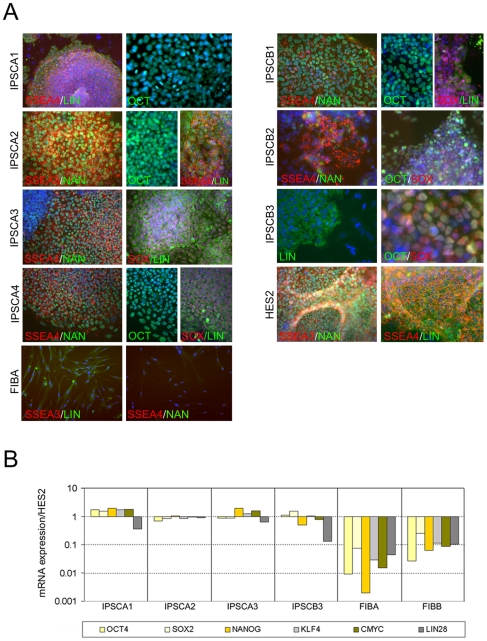
Figure 3. Indicators of cell phenotype and pluripotency in IPSC lines.
(A) Immunofluorescent analysis of pluripotency markers as labeled. Label color corresponds to marker color in images. Blue staining in all panels is DAPI labeling of nuclei. All IPSC lines displayed strong positive expression of pluripotency markers that were not observed at high levels in input FIB cells with the exception of the Lin28 antibody that reproducibly produced faint fluorescence in the cytoplasm of fibroblasts. (B) Representative QPCR analysis of FIB lines and reprogrammed IPSCs for markers of pluripotency and reprogramming factors relative to factor levels in hESCs. Input fibroblasts express very low levels of most factors whereas IPSCs display levels very similar to hESCs.

