Fig. 2.
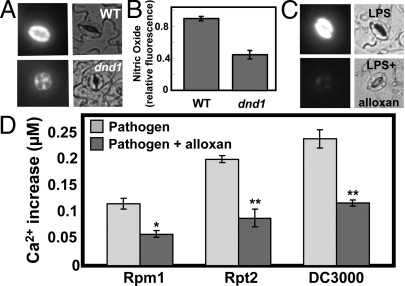
Cyclic nucleotide involvement in pathogen response signaling. Effects of cAMP and LPS on NO generation in guard cells are shown in (A–C). Pathogen-induced cytosolic Ca2+ elevation is shown in (D). (A and B) Results are shown for cAMP addition to WT or dnd1 leaf tissue. In the absence of cAMP, no fluorescence is evident in guard cells (e.g., see “buffer” image in Fig. 4C). (C) Results are shown for LPS addition (in the presence and absence of the adenylyl cyclase inhibitor alloxan) to WT tissue. (A and C) Fluorescence (left panels) and bright field (right panels) images are shown at a point (≈5–10 min after addition of cAMP or LPS) of maximal fluorescence. (B) Quantitative analysis of the NO fluorescence signals recorded in WT and dnd1 tissue after addition of cAMP (treatments correspond to those shown in A) are shown as treatment means (n = 3) of relative fluorescence intensity ± SE. This experiment was repeated a total of three times with similar results. For other fluorescence experiments monitoring in vivo generation of NO and ROS, quantitative analyses are shown in Fig. S4; see Fig. S4A for quantitative analysis of the experiment shown here in Fig. 2C. (D) Analysis of the pathogen-induced cytosolic Ca2+ elevation in the presence and absence of alloxan. For the experiments shown in Fig. 3 and the corresponding replications, mean [Ca2+] during the Ca2+ spike was ascertained for leaves inoculated with Pst avrRpm1, Pst avrRpt2, and Pst without avr genes ('DC3000′) in the presence and absence of alloxan. Mean values are shown for each treatment ± SE. ANOVA analysis was undertaken comparing the mean [Ca2+] in the presence and absence of alloxan. Bars with a * above indicate a significant effect of alloxan at P < 0.05 and bars with a ** above indicate a significant effect of alloxan at P < 0.01.

