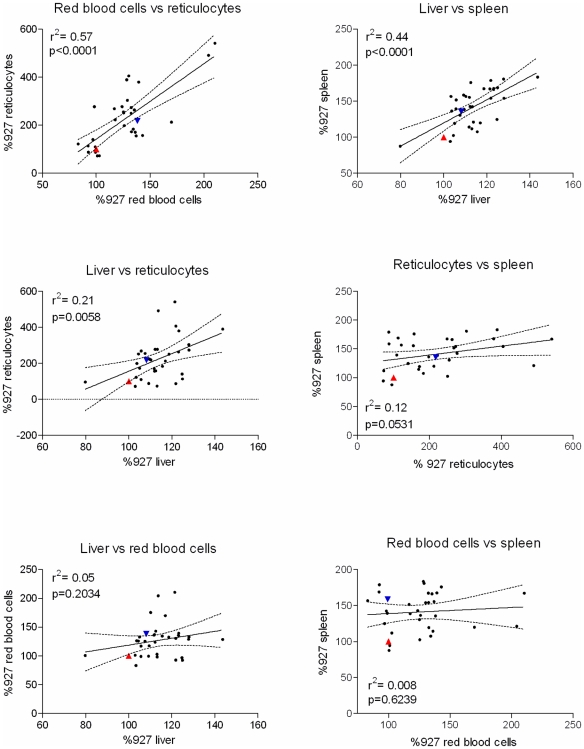
Figure 3. Pairwise correlations between phenotypic data for infections with parents and progeny (significance p<0.05; Pearson correlation coefficient).
The p-value and r2 value are indicated in each graph, and the line of best fit is also shown (dotted lines indicate the 95% confidence interval). Parental values are shown in each case, with the TREU927 value represented by the red triangle, and the STIB247 value by the inverted blue triangle.

