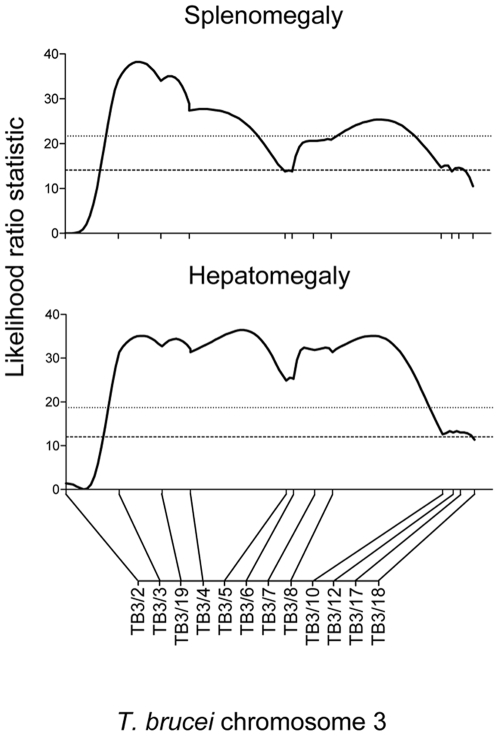
Figure 5. Significant QTLs for splenomegaly and hepatomegaly on chromosome 3 of Trypanosoma brucei.
The graphs show a chromosome scan of interval mapping for each phenotype, with the Likelihood Ratio Statistic (probability of linkage of phenotype to genotype; black line) measured in a stepwise manner at 1 cM intervals across the length of chromosome 3; chromosome 3 markers are shown on the x-axis (the scale on x-axis is in cM). The dashed and dotted lines represent the thresholds of significance (p<0.05) and high significance (P<0.001), respectively, for a genome-wide analysis.

