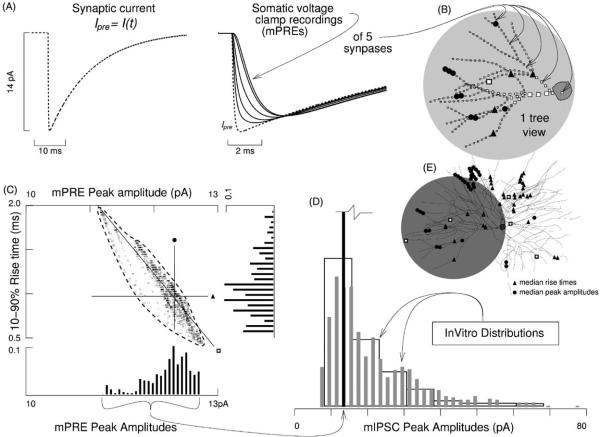
Fig. 2.
Paradigm 1: synaptic variability due to resistive–capacitive filtering. Identical predetermined synaptic currents Ipre = Isyn(t) were injected alternately into each of 1416 dendritic compartments. Ipre followed a double exponential time course, which we constrained with cesium based whole cell recordings of mIPSCs in TCNs of rat ventrobasal slice preparations maintained in vitro (Cox et al., 1997; LeFeuvre et al., 1997). These dendritic injections were recorded though a somatic voltage clamp. (A) Dashed trace depicts Ipre. Solid traces depict five example somatic voltage clamp recordings (mPREs). (B) Sites of five injections recorded somatically in (A). (C) mPRE data scatter plot, with marginal histograms. Each square marks the rise time and peak amplitude of the recording of an event at one of the compartments. The large crosshair marks the median rise time and median peak amplitude, with the closest mPRE defined as the median. Even though all injected currents were identical, their recordings were variable. This variability reflects how events at different dendritic sites are subjected to different degrees of low-pass filtering when viewed from the soma. The low-pass filtering is due to three factors: (1) membrane resistance, (2) membrane capacitance, and (3) morphology of the dendritic arbor. Note that the mIPSC amplitudes have the opposite skew of the mPRE amplitudes. Also note that the range of mPRE amplitudes is less than 10% of the range of mIPSC amplitudes. (D) Three histograms superimposed: one mPRE data set and two mIPSC data sets (Cox et al., 1997; LeFeuvre et al., 1997). Note the positive skew of mIPSC amplitude data. Each in vitro histogram is composed of several hundred events. Corrections were made for the differences in net ionic drive between the two studies; bin widths are 2 and 10 pA. (E) Bold open squares mark five synapses lying on and spanning the least squares line in (C). Uppermost square marks median in (C). Triangles and circles mark locations where the injected current resulted in an mPRE lying along the lines of the crosshair.

