
Fig. 3.
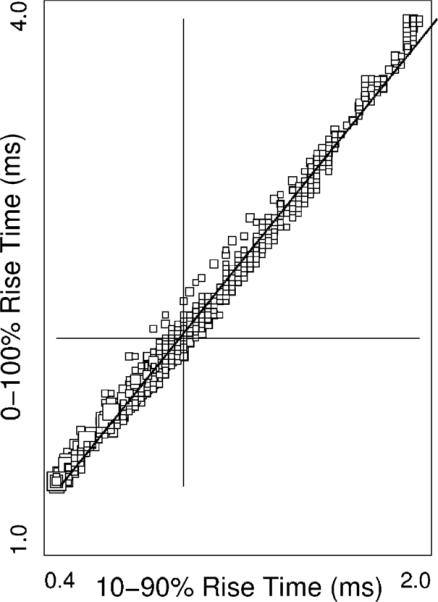
Temporal measures: cross plot of two different measures of the rising phase of the somatic recordings. Each square marks the corresponding values of the recording of an event in one of the compartments. Note that the 0–100% rise time can be accurately estimated from 10 to 90% rise time. Equation of the least square line is given in text.