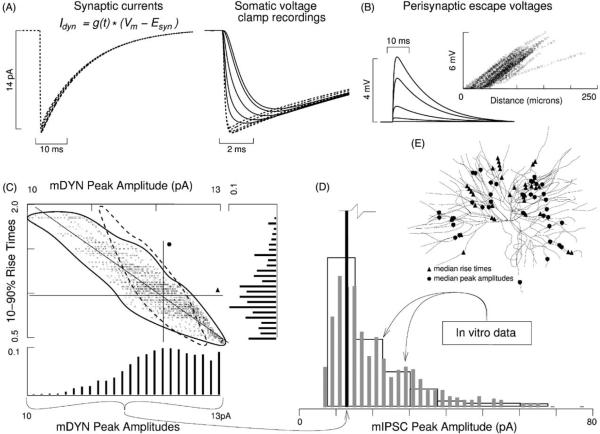
Fig. 5.
Paradigm 2: synaptic variability due to filtering, input resistance, and space clamp. Conductance based synaptic currents Idyn = Isyn(t, Vm) were injected alternately in each of 1416 dendritic compartments. The conductance time course gsyn(t) was defined by a double-exponential time course constrained such that the location that had yielded the median mPRE (uppermost square in Fig. 2E) now yielded a matching mDYN. (A) Spatial variation in local Rin and local space clamp quality led to a different Idyn at each location. Five example Idyns and mDYNs are given, corresponding to locations in Fig. 2B. Note the two-fold increase in variability of peak amplitude relative to Fig. 2A. (B) Perisynaptic escape voltages reflect space clamp quality and local Rin (see also Fig. 9B4). (C) mDYN data scatter plot, with marginal histograms. Each square marks the rise time and peak amplitude of the recording of an event at one of the compartments. The large crosshair marks the median rise time and median peak amplitude, with the closest mDYN defined as the median. Even though the conductances used at all locations were identical, their recordings of their currents were variable. This variability reflects how conductance based events at different dendritic sites are subjected differentially to three factors: (1) local input resistance, (2) local space clamp quality, and (3) low-pass resistive–capacitive filtering when viewed from the soma. The low-pass filtering is due to three factors: (1) membrane resistance, (2) membrane capacitance, and (3) morphology of the dendritic arbor. Note that, like the mPREs, the mDYN amplitude data is negatively skewed. The dashed curved is a re-plot of the mPRE envelope in Fig. 2C. Note the two-fold increase in amplitude variability. (D) Three histograms superimposed: one mDYN data set and two mIPSC data sets (Cox et al., 1997; LeFeuvre et al., 1997). Note that the mIPSC amplitudes have the opposite skew of the mDYN amplitudes. Also note that the range of mDYN amplitudes is less than 10% of the range of mIPSC amplitudes. (E) Triangles and circles correspond to mDYNs closest to the median crosshair lines given in (C). Compare with Fig. 2E.

