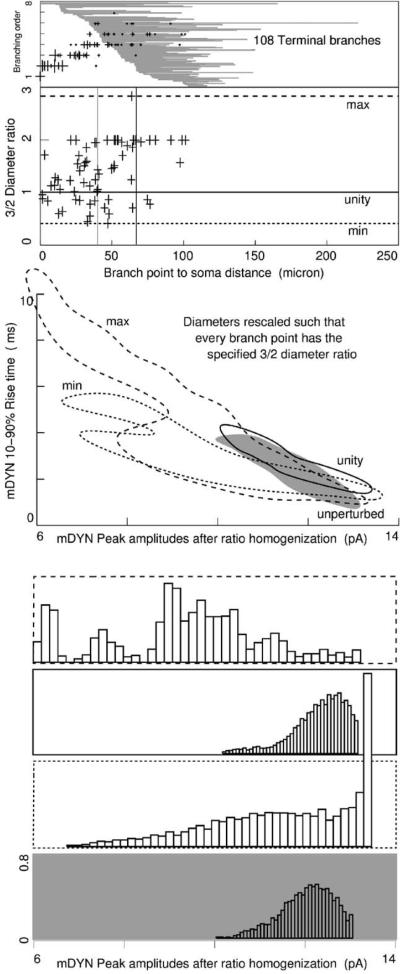
Fig. 8.
Diameters at branch points: to further extend the present results across nuclei and species we created three more models with new alternative morphologies. Diameters were tuned to homogenize the 3/2 ratios to values of the unperturbed maximum, unperturbed minimum, or unity, given by for daughter branch diameters di and parent branch diameter D. In the top panel, cross marks are placed at branch position and order and are sized to reflect D, revealing the characteristically rapid reduction in dendrite diameter. The 108 terminal branches are sorted by remoteness of the proximal end, stretched out horizontally and shown in grey. Second panel plots the 3/2 ratio of the 69 branch points. Vertical lines mark the median branch point distance (left), and the distance marking the 50/50 split of membrane area into distal and proximal halves (right). This left/right relationship reflects the bushy nature of thalamocortical arbors. Simulations were run on these new models, and resulting mDYN data envelopes are plotted, along with histograms of peak amplitudes. Again, range of variability in peak amplitude remained less than 10% of the range of mIPSC in vitro data. Except for the morphology with 3/2 ratios homogenized to the maximum, the skew of peak amplitudes continued to be opposite of mIPSC in vitro data.

