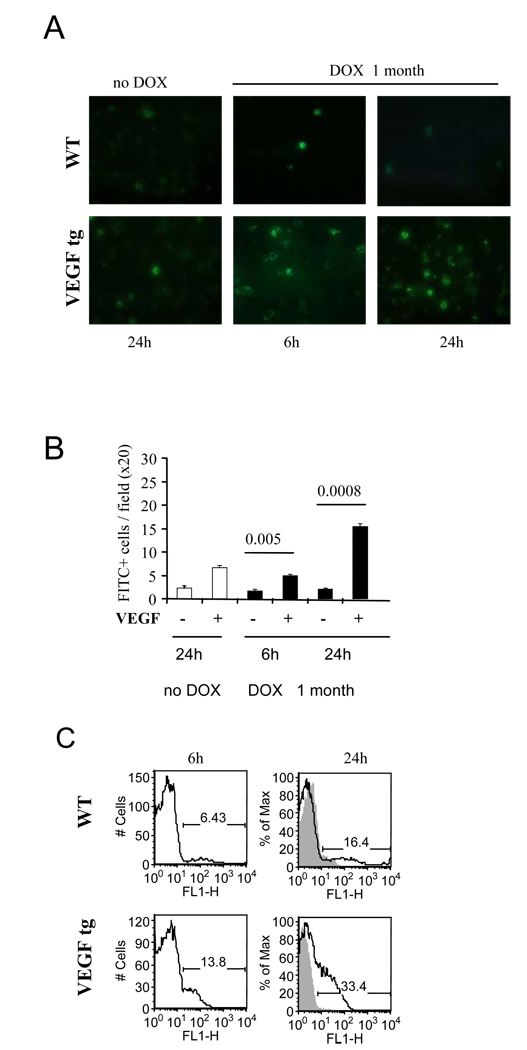
Figure 8.
VEGF-induced increase in the in vivo Ag transport by lung DC. The preexisting conditions for the experiments were as described in Figure 7 legends. Single cell suspensions from local lymph nodes were analyzed for FITC-positivity by either fluorescent microscopy of cytospinned cells (A–B) or flow cytometry (C). The results from one out of 3 representative experiments are shown. n=2 mice/group/experiment in 3 separate experiments. Fluorescent photomicrographs taken from WT and VEGF tg lymph node cells at 6h and 24h after intranasal OVA-FITC application (A) and FITC+ cells were enumerated (B). (C) The histograms show the percentage of OVA-FITC+ lymph node cells in the lung of OVA-FITC immunized mice (clear histogram) as compared to PBS-treated mice (gray histogram) at 6h and 24h after Ag (PBS) application.

