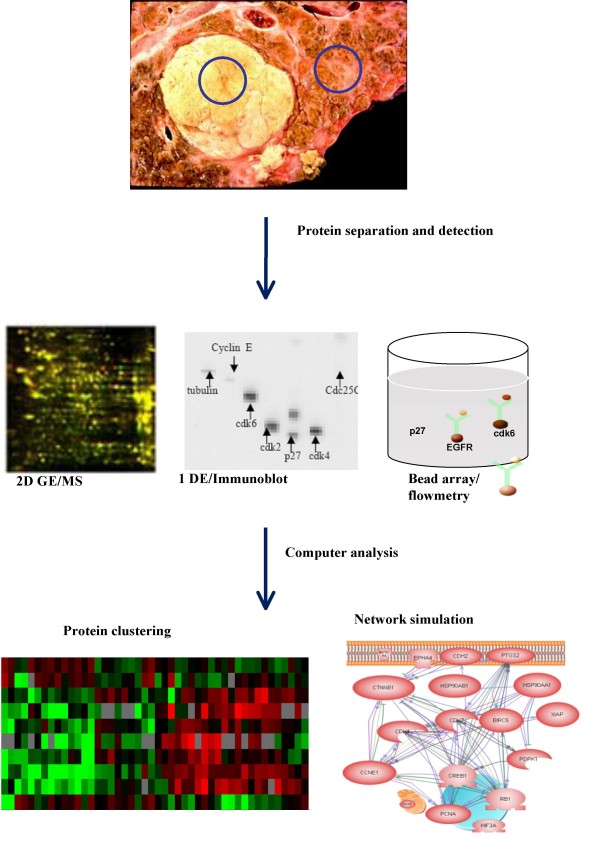
Figure 3.
Flow chart of Pathway Array analysis. The proteins from tumor and surrounding normal tissues are extracted and separated by 2 dimensional gel electrophoresis (2D GE), 1 dimensional gel electrophoresis (1 DE) or Luminex beads. The presence of specific proteins is detected by mass spectrometry (MS), immunoblot or flow cytometry. Various computer programs are used for data analysis, clustering and network simulation.

