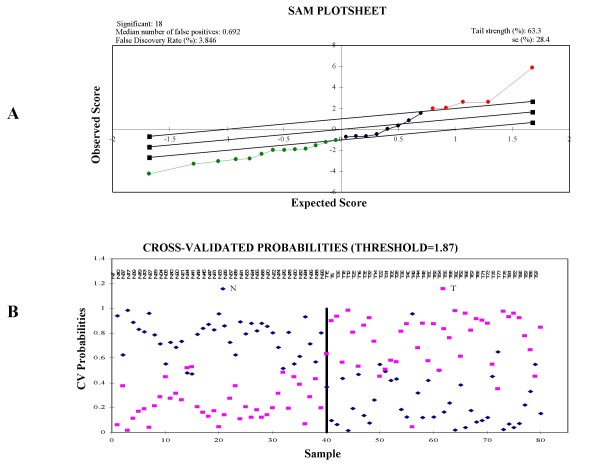
Figure 6.
Statistical analysis of Pathway Array results. A. SAM output of breast cancer data which showed a FDR 3.85% in 18 differently expressed proteins between tumor and benign tissues. B. PAM output of Cross-validated probabilities of 9 differently expressed biomarkers between lung cancer (T) and normal tissues (N).

