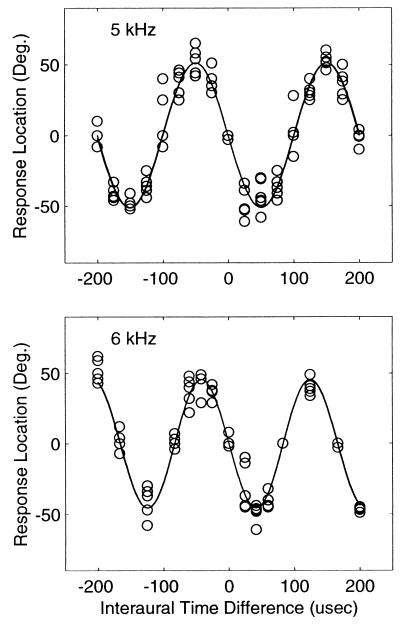
Figure 1.
Phase-ambiguous localization by owl 1. (Upper) Head-turning angles along the horizontal plane as a function of the ITD of a 5-kHz tone. Zero degrees is directly in front, and positive values are to the right of the owl. (Lower) Responses to a 6-kHz tone. Each symbol represents one head-turning response. There are a minimum of five responses per ITD. Head-turning angles vary as a sinusoidal function of ITD. The solid lines are two overlapping functions in each panel. One function is a 5-kHz sinusoid (Upper) and 6 kHz (Lower), and the other function is a sinusoidal fit to the data (4,969.8 Hz and 6,023.8 Hz in Upper and Lower, respectively).

