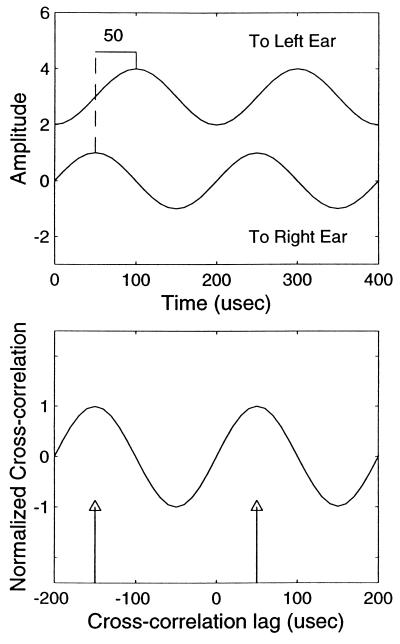
Figure 3.
Cross-correlation of narrowband signals. Top diagram shows two 5-kHz pure tones presented to the left and right ears. The waveform to the right ear is leading that to the left by ¼ period or 50 μsec. Equivalently, one may consider the left waveform leading the right by ¾ period. The two waveforms are of the same amplitude, but one has been vertically displaced in the figure for easier visual comparison. The lower panel shows the cross correlation of the waveforms to the left and right ears. The phase-ambiguous property of the waveforms results in two peaks in the cross correlation function at +50 and −150 μsec (arrows), corresponding to two directions in space. Note that the physiological range of the owl’s ITD encoding is ± 170 μsec.

