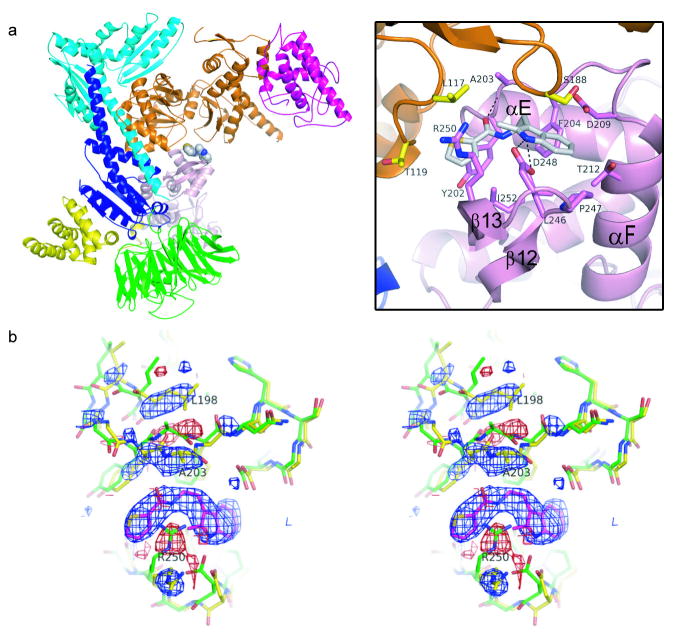
Figure 3.
Crystal structure of BtArp2/3 complex with bound CK-636. Color code: Arp3, orange; Arp2, pink; ARPC1, green; ARPC2, cyan; ARPC3, magenta, ARPC4, blue; ARPC5, yellow. a, Ribbon diagram with a detail of binding pocket. b, Stereo diagram of an Fo-Fc electron density map showing changes caused by CK-636. Positive (blue) and negative (red) difference densities indicate the position of CK-636 and small conformational changes of the protein. The apo-structure (1K8K pdb) is shown in green stick representation and the final structure in yellow. The density is contoured at 3.5 σ and was generated using structure factors calculated after one round of rigid body refinement and the data for the CK-636-soaked crystal.

