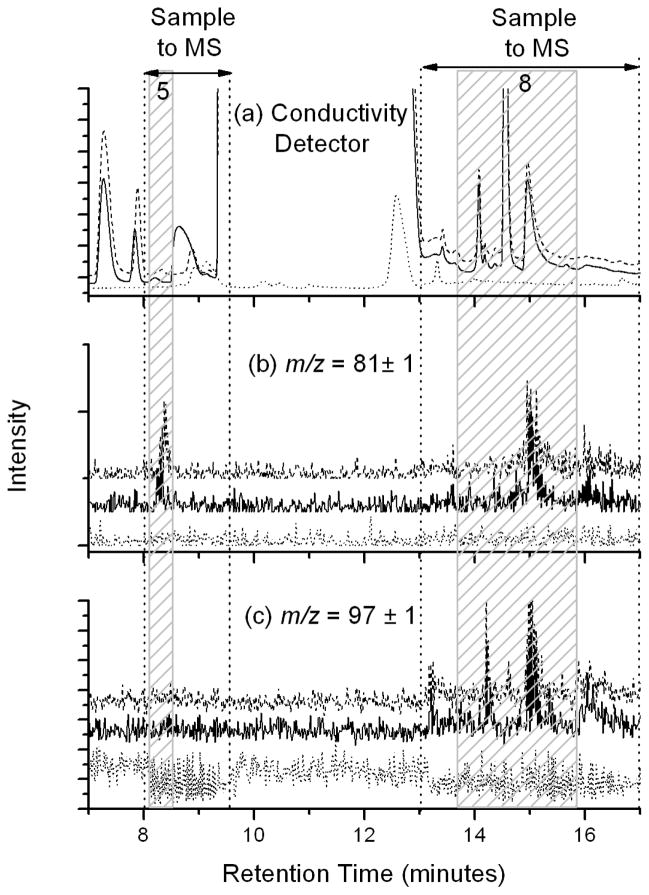
FIGURE 4.
Representative chromatographs of a spiked geothermal pool (dashed line), geothermal pool (solid line), and 18.2 MΩ water (dotted line) samples. Each were acquired using conductivity detection in series with mass spectrometer (MS) detection. The three panels present (a) conductivity detector data, (b) single ion monitoring data at m/z = 81 ± 1, and (c) single ion monitoring data at m/z = 97 ± 1, respectively. Shaded areas represent the retention times of (peak 5) phosphite and (peak 8) phosphate, respectively. IC effluent was directed to the MS only during time intervals bracketed between the dotted lines. Data are offset for clarity.

