Abstract
Purpose: The use of preclinical rodent models of disease continues to grow because these models help elucidate pathogenic mechanisms and provide robust test beds for drug development. Among the major anatomic and physiologic indicators of disease progression and genetic or drug modification of responses are measurements of blood vessel caliber and flow. Moreover, cardiopulmonary blood flow is a critical indicator of gas exchange. Current methods of measuring cardiopulmonary blood flow suffer from some or all of the following limitations—they produce relative values, are limited to global measurements, do not provide vasculature visualization, are not able to measure acute changes, are invasive, or require euthanasia.
Methods: In this study, high-spatial and high-temporal resolution x-ray digital subtraction angiography (DSA) was used to obtain vasculature visualization, quantitative blood flow in absolute metrics (ml∕min instead of arbitrary units or velocity), and relative blood volume dynamics from discrete regions of interest on a pixel-by-pixel basis (100×100 μm2).
Results: A series of calibrations linked the DSA flow measurements to standard physiological measurement using thermodilution and Fick’s method for cardiac output (CO), which in eight anesthetized Fischer-344 rats was found to be 37.0±5.1 ml∕min. Phantom experiments were conducted to calibrate the radiographic density to vessel thickness, allowing a link of DSA cardiac output measurements to cardiopulmonary blood flow measurements in discrete regions of interest. The scaling factor linking relative DSA cardiac output measurements to the Fick’s absolute measurements was found to be 18.90×CODSA=COFick.
Conclusions: This calibrated DSA approach allows repeated simultaneous visualization of vasculature and measurement of blood flow dynamics on a regional level in the living rat.
Keywords: small animal, digital subtraction angiography, cardiovascular, pulmonary, cardiac output, blood flow
INTRODUCTION
The use of small animals in research has increased in recent years because of the growing importance of rodent models in the elucidation of disease mechanisms.1 One of the most critical indicators of the physiologic responses to circulatory disease and drug stimuli is the rate and distribution of cardiopulmonary blood flow. A number of well-established techniques are used for measuring cardiopulmonary blood flow including the Fick method, thermodilution, magnetic flowmetry, microspheres, Doppler ultrasound, magnetic resonance imaging (MRI), computed tomography (CT), and positron emission tomography (PET).2, 3, 4, 5, 6, 7, 8, 9, 10, 11, 12, 13, 14, 15 Fick’s method is the gold standard for measuring cardiac output (CO) in absolute units (ml∕min); however, it is a global measurement of the entire body (nonregional). Regional measurements can be made using thermodilution, an advantage over Fick’s method, but the reported values are relative measurements. Magnetic flowmetry can produce absolute units (when properly calibrated), but is very invasive (a thoracotomy is commonly performed to gain access to the aorta for CO measurements). In addition, the internal vessels of the lung are out of reach for probe placement because most of the pulmonary vessel branches are within the lung parenchyma. Regional blood flow information can be obtained by the use of microspheres, an advantage over previous methods, but the results are relative values (commonly in units of concentration). Also, only a few acquisitions can be performed in the same animal, and microsphere techniques require euthanasia.
Noninvasive solutions that allow multiple measurements and vascular visualization in the same animal include Doppler ultrasound, MRI, CT, and PET. Ultrasound offers high-temporal sampling but is limited in measuring parenchymal blood flow because of the gas in the lungs. Additionally, the results are in terms of velocity (cm∕min) rather than flow (ml∕min). CT perfusion is an active area of research,16, 17, 18 but scaling CT to the spatial resolution necessary for small animals currently requires much longer scan times (several seconds to minutes), which is too long to capture rapid, acute changes in blood flow. Several different methods have been developed for perfusion MRI based on the flow or the use of injectable contrast agents.10, 19, 20 These methods are also challenging when translating them to the spatial and temporal resolutions required for small animals, and calibration can be particularly problematic.
We describe here a method that employs x-ray digital subtraction angiography (DSA) as a solution to these shortcomings. DSA is particularly appealing because it is easy to use and it can capture rapid physiological changes on a heart beat-to-beat basis.21 In DSA, a sequence of x-ray images is acquired pre- and post-injection of vascular contrast.22 The precontrast injection images are averaged to create a mask from which the post-contrast injection images are subtracted, resulting in the enhancement of the blood vessels while suppressing the background anatomy. Small animal DSA imaging has been described in previous work, which provides repeatable high-spatial and high-temporal resolution imaging in the living rodent.10, 23, 24, 25, 26 The anatomical imaging from DSA can be used to derive blood flow metrics using a nonparametric deconvolution technique.27 This blood flow calculation is a relative measurement specific to each animal. The focus of this work is mapping the relative flow metrics in DSA to an absolute metric through physiologic-based measurements—the Fick and thermodilution techniques. Fick’s method, the gold standard for measuring cardiac output,28, 29, 30 is the ratio of the total blood oxygen uptake by the peripheral tissues to the arterial-venous blood oxygen concentration difference.30, 31, 32, 33 The thermodilution technique is an indicator-dilution method where the regional blood flow is measured by noting temperatures changes induced at specific points through the injection of a cold liquid.30, 31, 33, 34
In this study, we used a novel modification to the thermal dilution method to link DSA to the Fick’s technique by using prewarmed contrast agent as the indicator for both the thermal dilution and DSA measurement. The resulting calibrated DSA solution provides (1) high-spatial and high-temporal resolution (100×100 μm2 at 10 frames∕s), (2) blood flow in absolute units (m∕min) and relative blood volume information at discrete regions of interest (ROIs) of the enhanced blood vessels, (3) transit time dynamics (s) on a pixel-by-pixel basis (100×100 μm2), and (4) multiple measurements in the same animal in rapid succession (every 30 s).
MATERIALS AND METHODS
Radiographic system
The radiographic system used for this work has been constructed for functional small animal imaging with both high-spatial resolution (100×100 μm2 pixels) and high-temporal resolution (10 ms exposures at 10 frames∕s).2, 23, 24, 25, 26, 35, 36, 37 The system employs a unique LABVIEW (National Instruments, Austin, TX) sequencer that allows synchronization of breathing, contrast injection, radiographic exposure, and digital frame acquisition with cardiac cycle. Images were acquired with x-ray techniques (80 kVp, 160 mA, and 10 ms) optimized for small animal DSA and thus limited beam hardening effects.26
Thermodilution measurements were acquired simultaneously with DSA images by capturing the output from the thermocouples with the LABVIEW sequence, which provided time sequences where the radiographic density of the DSA image was indexed to a thermodilution measurement at the same time. Each run was composed of 30 x-ray images following one contrast injection. The images were taken at the same point in the cardiac cycle (systole) during a brief period of apnea. This typically yielded one image every 160 ms (i.e., 6 frames∕s). The microinjector delivered a single 100±11 μl bolus of heated contrast agent for each run (8 in total) into the right atrium via the right jugular vein. The thermodilution sampling was started ∼6 s before the simultaneous acquisition with x-ray DSA to acquire baseline temperature values, and thermodilution sampling concluded ∼8 s after conclusion of x-ray DSA sampling to fully capture the temperature return to the initial values.
Animal surgical procedures
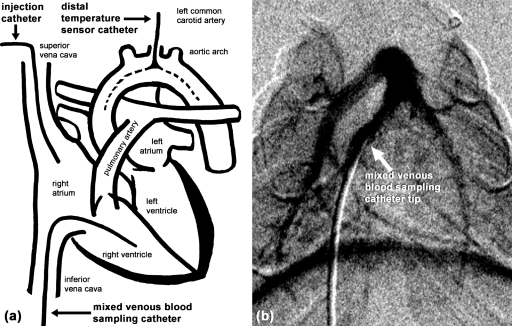
All animal studies were conducted according to a protocol approved by the Duke Institutional Animal Care and Use Committee. The studies were replicated in eight male Fischer-344 rats weighing between 251 and 287 g. The surgical procedures for the placement of catheters and a tracheal tube were performed after initial induction of anesthesia by an I.P. injection of Nembutal 50 mg∕kg (Ovation Pharmaceuticals, Deerfield, IL) and Butorphenol 1–2 mg∕kg (Fort Dodge Animal Health, Overland Park, KS). If needed, supplemental anesthesia of Nembutal 15 mg∕kg I.V. was given at approximately 30–45 min before the animal was placed on the ventilator. Once the animal was placed on the ventilator, anesthesia was converted to inhaled isoflurane (2%) for the duration of the experiment. Three different catheters were inserted (Fig. 1) for x-ray contrast agent injection (right jugular vein at the root of the superior vena cava), temperature measurement (left common carotid artery at the level of the aortic arch), and blood sampling (left femoral vein with the sampling site in the right ventricle). Animals were mechanically ventilated, kept warm, and monitored, as described previously.23, 24, 25, 26 The air supplied by the ventilator was 20.9±0.1% O2 and <0.6% CO2. The animals were euthanized at the end of the experiment with an injection of Nembutal at 250 mg∕kg of body weight.
Figure 1.
(a) Schematic drawing showing the catheter locations for contrast delivery (injection catheter), temperature measurement, and Fick’s blood. (b) DSA image shows verification of the mixed venous blood sampling catheter position.
Fick’s cardiac output
Fick’s CO method was used as the reference to calibrate the thermodilution-based CO scaling constant. This method relies on the observation that the total oxygen uptake by peripheral tissues is equal to the product of the blood flow to the peripheral tissues and the arterial-venous oxygen concentration difference.30, 31, 32, 33 Fick’s CO is mathematically expressed as30, 32
| (1) |
where is the oxygen uptake [ ventilation volume×(%O2 concentrationinhale−%O2 concentrationexhale)], CaO2 is the arterial blood oxygen concentration, and CvO2 is the venous blood oxygen concentration.
Two catheters were used to obtain the arterial and venous blood samples. Mylar collection bags connected to the ventilator captured samples of inhaled and exhaled breathing gas. To measure CvO2, a catheter in the left femoral vein was advanced up the inferior vena cava so that the catheter tip was in the right ventricle. A vena cava blood sample represents only a portion of the body, and a right atrial sample has incomplete venous mixing. The position of the catheter was verified using a single radiographic exposure. After acquiring 10 datasets of thermodilution- and x-ray-based CO measurements, ∼500 μl of venous blood was drawn from the left femoral vein catheter. Immediately after venous blood sampling, the distal temperature sensor catheter was used to withdraw ∼500 μl of arterial blood to measure CaO2 from the aortic arch, where the oxygen concentration is the highest. The arterial catheter served the dual purposes of acquiring arterial blood samples, as well as measuring temperature. The catheter insertion was guided by real-time blood pressure measurements and verified by x-ray imaging [Fig. 1b]. Blood samples were drawn into heparin-wetted syringes and placed on ice taking care to exclude air from the syringe. The blood gas was analyzed (682 CO-Oximeter, Instrumentation Laboratory, Lexington, MA) within 30 min of when the samples were drawn. During the blood sampling, the inhaled and exhaled breathing air was captured in gas sample bags for calculating O2 uptake . The blood and air samples took <3 min to be acquired. The oxygen concentration in the breathing and exhaled air was measured using a gas chromatograph (3800 Gas Chromatographer, Varian, Inc., Palo Alto, CA). The measurements were corrected to standard temperature and pressure, dry. Minute ventilation was measured using a spirometer.
Thermodilution-based cardiac output
The thermodilution technique is an indicator-dilution method where an injectate-induced temperature difference between two points in a region of flow is a function of the temperature change, the volume of injectate, and the heat characteristics of the injectate and blood. This is expressed by the Stewart–Hamilton equation 2,30, 31, 33
| (2) |
where Kthermo is the scaling constant, ρxcx is the density (g∕cm3) and specific heat (J∕(g °C)) of injectatex=i or bloodx=b, Vi is the injectate volume (ml), Tx is the initial temperature of injectatex=i or bloodx=b (°C), and ΔT is the temperature change between injectate and distal temperature sensors (°C).
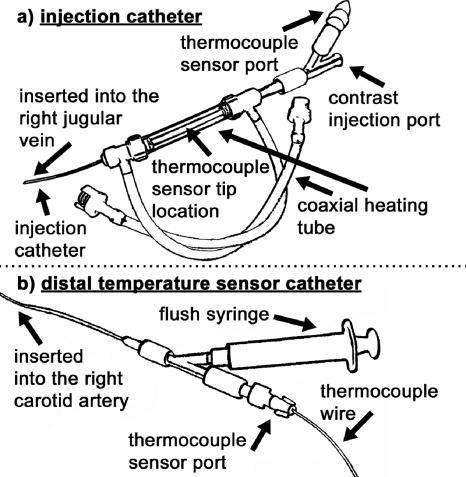
In the clinical setting,34 room temperature or chilled saline is injected in the right atrium and the temperature is measured at the tip of the catheter in the pulmonary artery using a multiport Swan–Ganz catheter. We used warmed x-ray contrast agent (Isovue-370, 370 mg iodine∕ml, Bracco Diagnostics, Princeton, NJ) to acquire x-ray DSA images and thermodilution curves at the same time. Another important design feature was that the distal temperature sensor was a separate catheter that was placed in the aortic arch via the left common carotid artery to allow adequate time for injectate-blood mixing because of the rapid heart rate of the rat (∼375 beats∕min). The injection catheter [Fig. 2a] was constructed from a series of cascading diameter PE tubes segments (3.75 cm, PE-50 at the tip to 1.25 cm, PE-190 to 6.5 cm, PE-240 at the end) to ensure that the catheter could fit in the jugular vein, while maintaining a large enough lumen to deliver the contrast agent.25 In addition, the injection catheter had a heating tube coaxially wrapped around the contrast catheter and ports for temperature measurement and contrast injection. The tubing segments (PE-190 and PE-240) heated by the coaxial heat tube held the majority (>90%) of the injectate volume. The remaining catheter length was in the rat and thus, at body temperature. A temperature-controlled water bath and a peristaltic pump were used to circulate warm water around the injection catheter via the coaxial heating tube. The coaxial heating tube was constructed from a pair of hemostasis valves with side ports (Part No. 80390, Qosina, Edgewood, NY). The heating assembly ensured the injectate temperature was maintained at 50±0.1 °C. A small (0.23 mm) thermocouple (T-type with 0.005 s time constant, IT-23, Physitemp, Clifton, NJ) inserted through the sensor port (2 Fr Touhy Borst adapter, Part No.: S19244, Qosina, Edgewood, NY) provided the temperature readings for the injectate. The injectate temperature was measured and recorded for the entire thermodilution technique. This was an improvement over current clinical and small animal thermodilution systems, where only one temperature sample is made in an external beaker.30, 31, 33, 34 In our approach, continuous temperature sampling and a closer temperature sensor placement to the injection site eliminated assumptions that no heat loss occurred between filling, connecting, and dispensing the injectate, as occurs in other systems. The microinjector used in this study delivered repeatable volumes (100±11 μl) of injectate10, 23, 24, 25 and was shown in previous work to have little effect on the blood flow physiology.25
Figure 2.
Thermodilution and x-ray DSA catheters. The injection catheter (a) delivered warmed contrast agent, and the distal temperature sensor catheter (b) measured the change in temperature downstream from the injection site.
The distal temperature sensor catheter [Fig. 2b] was inserted through the left common carotid artery and placed just superior to where the carotid artery branches from the aorta. This was the same catheter used to obtain the arterial blood sample for the Fick CO measurement. A 2 Fr Touhy Borst adapter, like the one used in the injection catheter, allowed for the thermocouple wire (IT-23) to pass out of the fluid-filled catheter for connection to the LABVIEW module. This fluid-tight connection allowed the thermocouple to be advanced or retracted under x-ray guidance when the Touhy Borst adapter was unlocked. This design allows one to guide the delicate sensor (∼0.15 mm diameter lead wires) through a length of winding vasculature (∼15–20 mm) under high systolic pressure (∼100–120 mm Hg at systole). Furthermore, sending only the thermocouple into the aorta allowed for repeatable positioning of the thermocouple and direct measurement of temperature changes with minimal disturbance of blood flow. Depending on the variation in the aortic arch for each rat, the sensor probe tip [represented by the dotted lines in Fig. 1a] was either just superior to the aortic valve in the ascending aorta (AA) or immediately after the arch in the descending aorta (DA). Given the different measurement locations, the thermodilution cardiac output measurement results were grouped into two categories—one for the sensor tip located in the DA (four rats) and the other for the sensor tip located in the AA (four rats). The DSA results were also grouped in this fashion because of the chain of calibrations linking DSA to thermodilution.
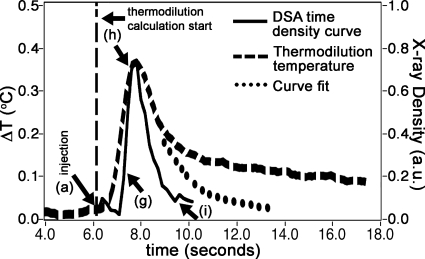
Thermocouples were sampled 12 times∕s in the USB-9211A module of our monitoring system (National Instruments, Austin, TX) using LABVIEW software developed in-house. Of note is the calculation of the denominator term of the Stewart–Hamilton equation, ∫ΔT(t)dt in Eq. 2. The area under the temperature change curve (Fig. 3) was composed of two parts. The first part was the area under the temperature change curve that ranged from immediately after the contrast injection to 40% of the maximum temperature change in the descending limb of the graph. The second part was the area under an exponential curve that was fitted (circle-dotted curve) on the down slope, starting from 40% of the maximum temperature change.30, 31 This fit was based on the descending temperature range of 80%–40% of the maximum temperature change value and was done to mitigate effects of indicator recirculation that resulted in a long, gradually decreasing temperature change tail (curve from 10 to 18 s).
Figure 3.
A plot of the time density curve (right, y axis) and the thermal dilution (left, y axis) measure shows the coincidence of the two. The letters (a, g, h, and i) refer to the DSA x-ray series seen in Fig. 4 at specific time points during the run.
Ten thermodilution measurements, each separated by 2 min,30 were made for each rat. Statistics (average, standard deviation, and coefficient of variation) showing the CO measurements were found for each rat. The thermodilution scaling constant (Kthermo) was then calculated Eq. 3 for each rat by
| (3) |
so that the relative thermodilution CO measurement matched that rat’s specific absolute Fick’s CO measurement.
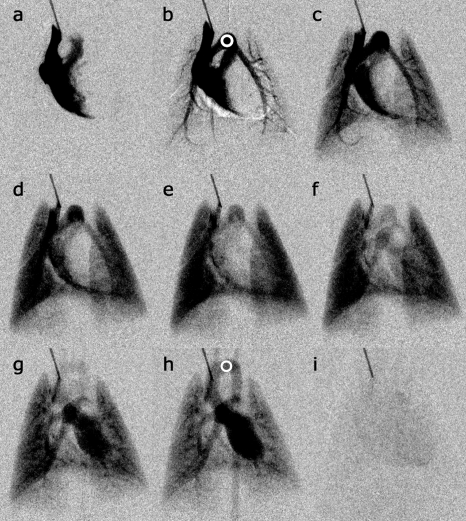
Singular value decomposition (SVD), based on the work of Ostergaard et al.,27 was used to find the relative flow rates. The method allows for measurements independent of the measurement region.38 Briefly, the flow rate in a vessel can be estimated by deconvolving the effects of the vasculature from contrast concentration curves. In this case, the curves are pixel value changes in x-ray intensity over time [time density curve (TDC)]. Typically, an input [arterial input function (AIF)] in the shape of a square impulse function at a proximal vessel location will become a delayed, dispersed curve at a distal vessel location. While there are other ways of deconvolving, SVD has proven superior in several previous studies.38, 39, 40 The relative blood volume can be estimated from the area under the time-concentration curve normalized to the area under the AIF curve.27 Mean transit time (MTT) can be calculated following the central volume theorem by the blood volume divided by the flow rate.27 In essence, the MTT is related to the center of mass under the time density curves, not amplitude of the time density curve, and so was calculated separately from the vessel thickness correction described in Sec. 2E. For each run, regions of interest (ROIs) were taken of the ascending aorta and the pulmonary artery root (AIF).25 The aortic and AIF concentration time curves were realigned to a common signal maximum41, 42, 43 to correct for bolus delay errors. The ROIs were drawn so that no overlying enhanced blood vessels were included (see ROIs in Fig. 4).
Figure 4.
Selected DSA images show (a) initial arrival of contrast in the right ventricle, (b) filling of the pulmonary arterial system, (c) early to (d) midfilling of the parenchyma, (e) complete parenchymal filling, (f) pulmonary veins and early left heart filling, (g) left ventricle filling and early aorta enhancement, (h) complete aorta filling, and (i) contrast has passed through cardiopulmonary system. Note that the bolus is sufficiently compact that the different stages of flow can be temporally isolated. The ROIs (circles) in (b) show the AIF and in (h) show the aorta, which are used for the blood metric calculations.
The DSA scaling constant (KDSA) was calculated [Eq. 4] for each rat by
| (4) |
so that the relative x-ray DSA CO measurement matched that rat’s specific calibrated thermodilution CO measurement.
In a contrast-filled vessel, the signal intensity change after logarithmic subtraction is linearly related to the contrast agent concentration in the vessel.44, 45 This was experimentally verified in the live rat by plotting the peak DSA signal for several major vessels for injection volumes of 50, 100, and 150 μl. Two DSA runs in the same rat were made for each injection volume for a total of 6 runs. Because the DSA CO was calibrated to the location-dependent (DA or AA) thermodilution results, there was a need to measure how independent the DSA calibration factors were between the DA and AA cases. This was done by comparing the percent difference between the product of calibration factors Kthermo×KDSA within the DA and AA cases by combining Eqs. 3, 4: COFick=Kthermo×COthermo and substituting COthermo=KDSA×CODSA into the former resulted in
| (5) |
where COx is the cardiac output measured by Fick, precalibrated thermodilution, or precalibrated DSA, Kthermo×KDSA is the product of calibration factors.
The percent difference was calculated by
| (6) |
where KDA is the average Kthermo×KDSA for the descending aorta and KAA=average is the average Kthermo×KDSA for the ascending aorta.
SVD flow metric vessel thickness correction and experimental verification
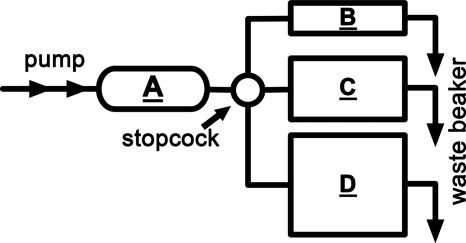
The SVD calculation deconvolves an arterial input TDC from a distal vessel TDC.27 The maximum height of the residue function from the deconvolved TDC is the relative flow rate.46, 47 Given the same AIF and only amplitude scaling differences in the distal vessel TDCs, the same scaling applies to the deconvolved result. Logarithmically subtracted x-ray angiography images produce signal intensity values that are linearly related to the cross-sectional contrast thickness of the vessel.44, 45 At the same flow rate, a contrast-filled vessel that is twice as thick will yield a TDC with a peak that is twice as high. We corrected for this vessel thickness modulation using the width of the projected vessel to determine the thickness. The vessel thicknesses were estimated using a threshold-based method48 and an approach similar to Clough et al.45 Briefly, a minimum intensity projection of the DSA images was filtered and thresholded to extract the contrast-filled vessels. A distance transform was performed to find the distance of each pixel in the vessel from the nearest vessel boundary, and skeletonization was performed to locate the pixels on the central axes of the vessels.49, 50 A line segment was constructed over each skeleton pixel at an angle perpendicular to the central axis, and the distance value at the skeleton pixel was then used to assign thickness values to all pixels along the line segment from one end of the tube to the other. Assuming that a cylindrical vessel was parallel to the imaging plane and there was constant attenuation inside the vessel, a radius-to-thickness transform was applied, , where R is the vessel radius and x is the distance of the pixel along the line segment from the skeleton pixel.45 Using the same ROIs for the SVD calculations, the average inner diameter of a common vessel (aorta in the live animal) was measured and served to scale the pulmonary blood flow (PBF) in the other vessels. We performed phantom experiments to verify the impact of vessel thickness on PBF calculations. The phantom (Fig. 5) was constructed from four lengths of Tygon tubing. Tube A contained 500 μl of x-ray contrast agent (Isovue-370) and represented the AIF in the SVD calculations. Tubes B, C, and D represented the distal vessels. A syringe pump connected to tube A ran at 50 ml∕min and ten x-ray images were acquired every second for 30 s. Four sets of DSA images were acquired for each of the three distal vessels (12 datasets in total). The images were processed as in the live animal study, the SVD-based flow calculation was performed, and the vessel thickness correction was applied. The p values (one-way ANOVA) of the pulmonary blood flow results with and without thickness correction were determined between tubes B and C and tubes D and C (tube C was what tubes B and D were scaled to using the thickness correction). The vessel thickness correction was then applied to the live animal data. In the live animal, the correction and calibration was only done for vessels that could be resolved. The lung parenchyma was an area where the microvessels are smaller than what the x-ray detector could resolve. In those areas, the SVD vessel thickness correction was not applied.
Figure 5.
A flow phantom was used to verify the SVD-based flow calculations between three vessels of differing diameters (B=1.14 mm, C=2.06 mm, and D=2.79 mm). Tube A was the AIF.
RESULTS
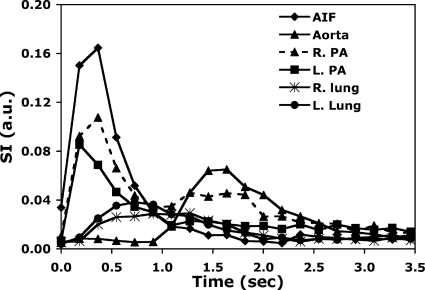
Figure 4 shows representative images of the raw DSA data used for the calibrations, which show (a) the initial inflow of contrast into the right atrium and right ventricle, [(b) and (c)] flow from the right ventricle out the pulmonary artery, [(d)–(f)] flow back into the left atria, and [(g) and (h)] flow out of the left ventricle into the arterial system. Note that in Fig. 4, DSA has the ability to separate the venous and arterial phases of pulmonary blood flow. While there are periods where arterial and venous structures are superimposed, the high-temporal resolution and tight boluses allow us to clearly separate these structures in both time and space. Figure 6 shows the time density curve in the aortic arch, pulmonary arteries, and lung parenchyma. The temporal resolution (160 ms) is sufficient to capture 10 points defining the most rapidly changing points of the time density curve. At peak opacification, the spatial resolution (100 μm) is more than sufficient to provide an accurate measure of the diameter of the aortic arch [Fig. 4h] and many of the branching vessels in the pulmonary system.
Figure 6.
Time density curves of the same rat in Fig. 4 showing signal changes at specific regions over time. The same types of time density curves are measured on a pixel-by-pixel basis and are used to calculate the SVD-based flow metrics. AIF: Arterial input function; R.PA: Right pulmonary artery; L.PA: Left pulmonary artery; R.Lung: Right lung parenchyma; and L.Lung: Left lung parenchyma.
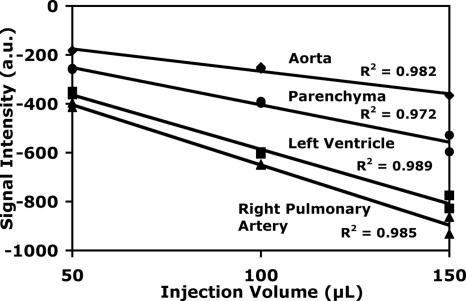
Linearity between concentration and peak signal in the time density curve is critical for the SVD calculations. The first measurement in Fig. 7 demonstrates the peak signal intensity vs the volume of the injected bolus for a number of critical structures. Two DSA runs were executed in the same rat for each injection volume. As expected, a larger injection volume resulted in higher contrast agent concentrations and a higher peak signal (more negative in the subtracted images). Linear fits were applied and the R2 values were all >0.97, indicating the linearity between signal intensity and contrast concentration.
Figure 7.
Peak DSA signal intensity in the right pulmonary artery, left ventricle, parenchyma, and aorta plotted versus injection volume. Linear fits yielded R2>0.97 for all plots (R2=0.98, 0.97, 0.99, and 0.99 for aorta, parenchyma, left ventricle, and right pulmonary artery, respectively).
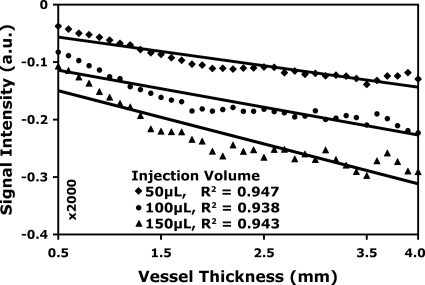
Blood flow derived from the SVD is dependent on the peak of the TDC, which, in turn, is dependent on the diameter of the vessel. Linearity with respect to volume of the bolus is not sufficient. Figure 8 shows the peak signal from the pulmonary vessels and the heart as a function of vessel thickness (assuming the heart as a large vessel), where the thickness is estimated from the vessel width. Data are plotted again for three different volumes of injections. The fit to a linear model shows R2>0.94.
Figure 8.
Peak DSA signal versus thickness of the pulmonary vessels and the heart (assumed as a large vessel) for 50, 100, and 150 μl injections of contrast agent. Note the linearity of the fits, R2>0.93 (R2=0.95, 0.94, and 0.94 for 50, 100, and 150 μl injection volume, respectively).
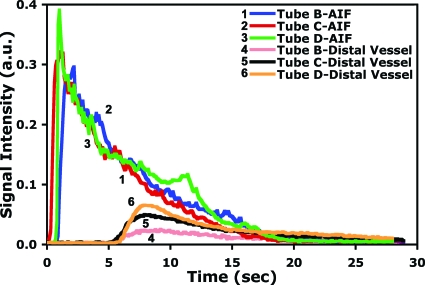
Finally, the results from the flow phantom were used to validate the SVD calculations for vessels of differing size with constant flow. The phantom is shown in Fig. 5 and the representative time density curves are shown in Fig. 9. A summary from four TDCs for each tube is included in Table 1. The uncorrected pulmonary blood flow is derived from each TDC. As expected, when correction for the vessel thickness is included, the SVD-derived flow is the same for all three vessels.
Figure 9.
Representative time density curves of the flow phantom at the AIF (tube A in Fig. 5) and the distal vessels (tubes B, C, and D). An external pump was used to deliver the same flow rate through the three tubing sizes.
Table 1.
Flow metric results for the phantom experiment before and after vessel thickness correction. There was statistically significant precorrection difference between tubes B and C (p value <0.0001) and tubes D and C (p value <0.035). The prethickness corrected pulmonary blood flow values increased with an increase in tube diameter even though the same pump rate was used. No statistically significant difference was noted after the thickness correction between tubes B and C (p value >0.839) and tubes D and C (p value >0.471), an indication that matches the reality of the pump being operated at the same rate for all three tubes. In addition, there was no statistically significant difference (p value >0.828) before and after the thickness correction for tube C because the scaling was to itself. Four DSA runs were made for each tube size.
| Tube | Thickness (mm) | SVD flow (a.u.—volume∕time) | Corrected flow (a.u.—volume∕time) |
|---|---|---|---|
| B | 1.14 | 0.044±0.006 | 0.079±0.007 |
| C | 2.06 | 0.078±0.003 | 0.078±0.006 |
| D | 2.79 | 0.093±0.011 | 0.074±0.008 |
Fick’s cardiac output
Table 2 shows the summary of the calibrations. Using Fick’s method, the average CO between eight rats was 37.0±5.1 ml∕min and cardiac index was 137.8±19.0 ml∕min kg (13.9% Cv).
Table 2.
Measured and calculated values of CO using Fick’s method, thermodilution, and x-ray DSA arranged in two groups—the distal temperature sensor in the DA and AA. Ten thermodilution samples and ten x-ray DSA sequences were acquired for each rat.
| Rat | Total Avg. | Total Stdev. | Total Cv | |||||||||||
|---|---|---|---|---|---|---|---|---|---|---|---|---|---|---|
| 1 | 2 | 3 | 4 | 5 | 6 | 7 | 8 | |||||||
| Weight (g) | 268 | 273 | 287 | 261 | 262 | 273 | 251 | 273 | 268.5 | 10.7 | 4.0 | |||
| Heart rate (BPM) | 359 | 382 | 349 | 364 | 370 | 382 | 376 | 414 | 374.5 | 19.6 | 5.2 | |||
| Fick’s method CO (ml∕min) | Avg. | Std. | Cv | |||||||||||
| 37.15 | 35.03 | 30.37 | 30.85 | 45.24 | 41.99 | 36.23 | 39.37 | 37.0 | 5.1 | 13.9 | ||||
| Thermodilution CO (a.u.), precalibrated | ||||||||||||||
| Distal temp. sensor: | In descending aorta (DA) | In ascending aorta (AA) | ||||||||||||
| Avg. | 76.4 | 82.5 | 64.1 | 78.7 | 39.1 | 46.9 | 46.2 | 53.1 | ||||||
| Stdev. | 2.8 | 3.6 | 3.5 | 2.5 | 5.0 | 4.2 | 2.1 | 5.4 | ||||||
| Cv (%) | 3.65 | 4.35 | 5.51 | 3.20 | 12.89 | 9.03 | 4.55 | 10.15 | ||||||
| Avg. | Stdev. | Cv | Avg. | Stdev. | Cv | |||||||||
| Kthermo | 0.49 | 0.42 | 0.47 | 0.39 | 0.44 | 0.04 | 9.8 | 1.16 | 0.90 | 0.78 | 0.74 | 0.89 | 0.19 | 20.8 |
| X-ray DSA CO (a.u.), precalibrated | ||||||||||||||
| Distal temp. sensor: | In descending aorta (DA) | In ascending aorta (AA) | ||||||||||||
| Avg. | 1.79 | 1.95 | 1.61 | 2.12 | 1.93 | 2.02 | 1.88 | 2.51 | ||||||
| Stdev. | 0.40 | 0.31 | 0.36 | 0.30 | 0.28 | 0.20 | 0.19 | 0.49 | ||||||
| Cv (%) | 22.47 | 16.04 | 22.38 | 13.93 | 14.51 | 9.71 | 10.19 | 19.67 | ||||||
| Avg. | Stdev. | Cv | Avg. | Stdev. | Cv | |||||||||
| KDSA | 42.76 | 42.34 | 39.79 | 37.06 | 40.48 | 2.63 | 6.5 | 20.30 | 23.25 | 24.57 | 21.18 | 22.33 | 1.94 | 8.7 |
Thermodilution-based cardiac output
Ten thermodilution and simultaneous x-ray-based CO measurements were made for each of the eight rats. The average of those values was used to obtain Kthermo, the scaling factor linking thermodilution to Fick’s method results. The impact on cardiac output because of changes in the total blood volume is sensitive to the rate of transfusion∕hemorrhage. In our study, 1 ml of contrast agent (readily cleared by the kidneys) was added in 10 injections of 100 μl volume over 20 min. Because the injected volume of the warmed contrast agent was small (100 μl), the net temperature increase in the animal was <0.4 °C (Fig. 3) and there was minimal impact on the rat’s vascular physiology (∼16 ml of the total blood volume). Given the different measurement locations (ascending or descending aorta), the temperature change readings were significantly different, up to 48%. The temperature difference between the two measurement locations (descending or ascending aorta) resulted in different calibration constants for Kthermo. The precalibrated thermodilution-based CO measurements averaged 75.4±8.0 a.u. with the probe in the descending aorta and 46.3±5.7 a.u. with the probe in the ascending aorta. Because the thermodilution measurement was sensitive to the temperature probe placement and the DSA was calibrated to thermodilution, the DSA calibration factors were grouped with thermodilution to the DA and AA cases: KDSA (DA) was 40.5±2.6 and KDSA (AA) was 22.3±1.9 with an 8.7% Cv for the AA measurements. A measure of independence was performed between the DA and the AA calibration factors to assure that DSA calibration factor was not affected by the location specific thermodilution calibration. The aggregate calibration of DSA to Fick’s via thermodilution was obtained by multiplying Kthermo and KDSA [Eq. 5]. The result is 18.9(±1.8)×CODSA=COFick. The standard deviation in the conversion (9.5%) is less than the 14% variation we saw in the gold standard (Fick’s), suggesting that the measurements at AA and DA are consistent.
X-ray DSA-based cardiopulmonary blood flow
Finally, Fig. 10 shows the SVD-derived flow metrics of the same rat in Fig. 4. The lung parenchyma contains many small vessels and capillary sizes that are smaller than what the x-ray detector could resolve. This produces a blush in the region rather than clearly defined vasculature. Thus, the thickness correction was not applied to these areas, and pulmonary blood flow values are presented only for specific vessels where the correction for attenuation derived from the vessel thickness could be applied. The blood transit time was calculated on a pixel-by-pixel basis and allowed for measurement of transit time dynamics on a regional basis—ranging from major vessels (i.e., aorta) to tissue (i.e., lung parenchyma). In the MTT map, there was fast transit time in the major vessels (pulmonary artery—arrow, 0.47 s) and higher transit time in the more distal locations where the main vessels became capillaries. The lung parenchyma right lower lobe showed a 1.22 s MTT (large circle) and a 1.32 s MTT in the right upper lobe (small circle). Table 3 shows the average mean transit time at specific regions (aorta, pulmonary arteries, and lung parenchyma) for all eight rats in this study. As expected, the transit time is greater in the parenchyma (>0.93 s) than in the major vessels (<0.45 s).
Figure 10.
(a) SVD-derived PBF, (b) pulmonary blood volume, and (c) MTT of the same rat on a pixel-by-pixel basis. There was rapid transit in the major vessels (arrow shows pulmonary artery) and longer transit time in the more distal locations (circles indicate lung parenchyma).
Table 3.
Average mean transit times at specific regions of interest for all rats (n=8) in this study.
| Region of interest | Mean transit time (s) |
|---|---|
| Aorta | 0.22±0.01 |
| Right pulmonary artery | 0.42±0.04 |
| Left pulmonary artery | 0.44±0.05 |
| Right lung parenchyma | 1.15±0.09 |
| Left lung parenchyma | 0.93±0.07 |
DISCUSSION
Fick’s method for cardiac output determinations is based on the ratio of an animal’s rate of oxygen extraction across the heart to the total body consumption of oxygen (metabolism). A major limitation to the Fick method is that only cardiac output and not regional blood flow measurements can be made. In addition, the blood withdrawal process is slow and requires near steady-state respiratory gas exchange, so acute, rapid changes may not be captured. These limitations are not present for thermodilution and DSA-based measurements, allowing multiple blood flow measurements to provide a statistical foundation as part of the calibration process, rather than calibrating DSA to a single Fick’s CO measurement.
For the live animal study, the rat strain, sex, body weight, physiologic state, and anesthetic type (or conscious state) can significantly impact the cardiac output.5, 6, 8, 12, 51, 52 The cardiac output in the rat can range from 25 ml∕min in a deeply anesthetized rat29 to 50 ml∕min in a conscious rat.4 In previous work using the Fick’s method, CO measurements in the same animal yielded <5% variation between measurements.53, 54 The variation can be related to the increased complexity of this study over previous work by the inclusion of thermodilution and DSA. An absolute comparison of CO between this study and previous work is difficult to make because the anesthesia type, surgical complexity, and rat size and strain (if given) were different than in this study. Papovic et al.53 reported (strain not given) CO=65.0±1.8 ml∕min (2.8% Cv) and cardiac index=204.0±5.6 ml∕min kg for rats with average body weight=318.6±9.0 g, while Walsh et al.54 reported CO=41.1±2.0 ml∕min (4.9% Cv) in Sprague Dawley rats and CO=39.9±3.0 ml∕min (7.5% Cv) in Wistar rats. The body weights ranged from 175 to 250 g. Using the Fick’s method in this study produced similar CO values as another study (43±10 ml∕min) that used microspheres in anesthetized male Fischer-344 rats of similar body weight.4, 14 The variations in Fick’s method between the DA rats were <10% and <14% in the AA rats. Grouping all eight rats in this study showed a <10% variation. The resulting data for this rat strain and weight, anesthesia type, and imaging system parameters provide us a quantitative, noninvasive, image-based measure of blood flow traceable to an absolute physiologic measurement with reproducibility in the calibration within the variability of Fick’s method itself.
The DSA method also has some limitations. The SVD calculation assumes no dispersion of contrast agent. The effect of contrast dispersion can be corrected for by using a finite element vasculature model approach.43 However, this approach, to date, is a vessel-specific solution rather than a general solution. Contrast bolus delay effects must be corrected by realigning the TDCs and the AIF to a common signal maximum.41, 42, 43 Rats of grossly different anterior-posterior dimensions will result in x-ray intensity changes inversely proportional to the object thickness. Signal intensity shifts because of specimen anatomy are suppressed while the contrast-filled vasculature is highlighted in DSA because of the logarithmic subtraction,26 which mitigates the TDC amplitude dependency on the specimen thickness. However, variations in contrast-filled vessel thickness can modulate PBF. Therefore, the PBF must be corrected by scaling the vasculature to a common vessel. This is not possible in the lung parenchyma where many vessels are smaller than the x-ray detector can resolve. The vessel thickness correction assumes a cylindrical vessel that is parallel to the imaging plane. DSA is a planar imaging method and thus the superposition of enhanced structures can result in an overestimation of relative blood volume.
A projection of the parenchyma could be treated as the superposition of many overlapping capillaries. It is possible to use a volumetric imaging modality like micro-CT to find the thickness of the parenchyma at each pixel. A volumetric coronal dataset of the segmented lung would be flattened to produce a 2D projection image. This projection image would represent the thickness of the parenchyma at each pixel. Lastly, the projection image would be registered to and applied as a thickness correction for the DSA image sets. Some work has already been done in combining DSA (a projection-based imaging method), with CT (a tomographic method).24
Even with these limitations, the method provides a valuable new tool for functional preclinical imaging. This small animal DSA system has these advantages because it can perform the following: Minimally invasive in vivo blood flow measurements in the same animal in a rapid succession (every 30 s), at very high resolution (up to 100 μm), with quantitative blood flow in absolute metrics (ml∕min) from discrete ROIs, and with mean transit time dynamics on a pixel-by-pixel basis (100×100 μm2). This new method can provide exacting solutions to real-time anatomical and quantitative functional data acquisition in the living rat to evaluate drug- or disease-modulated cardiac output and pulmonary blood flow dynamics.
ACKNOWLEDGMENTS
The authors wish to thank David S. Enterline, M.D., and James Waples for the information about the contrast agent, Robert Behringer, Ph.D., for insightful discussion about fluid dynamics, Eric Alford and Aaron Walker for running blood gas and air sample analyses, Owen Doar for scheduling and coordinating the aforementioned analyses, Jim Pollaro, M.S., for the ventilator software control interface and monitoring system, and Laurence Hedlund, Ph.D., for animal support and surgery. All work was performed at the Duke Center for In Vivo Microscopy, an NCRR National Biomedical Technology Research Center (Grant No. P41 RR005959) and NCI Small Animal Imaging Resource Program (Grant No. U24 CA092656), and the Duke Center for Hyperbaric Medicine and Environmental Physiology.
References
- Paigen K., “A miracle enough: The power of mice,” Nat. Med. 1, 215–220 (1995). 10.1038/nm0395-215 [DOI] [PubMed] [Google Scholar]
- Badea C., Fubara B., Hedlund L., and Johnson G., “4D micro-CT of the mouse heart,” Mol. Imaging 4, 110–116 (2005). [DOI] [PubMed] [Google Scholar]
- Corman B., Duriez M., Poitevin P., Heudes D., Bruneval P., Tedgui A., and Levy B. I., “Aminoguanidine prevents age-related arterial stiffening and cardiac hypertrophy,” Proc. Natl. Acad. Sci. U.S.A. 95, 1301–1306 (1998). 10.1073/pnas.95.3.1301 [DOI] [PMC free article] [PubMed] [Google Scholar]
- Delp M. D., Evans M. V., and Duan C., “Effects of aging on cardiac output, regional blood flow, and body composition in Fischer-344 rats,” J. Appl. Physiol. 85, 1813–1822 (1998). [DOI] [PubMed] [Google Scholar]
- Hachamovitch R., Wicker P., Capasso J. M., and Anversa P., “Alterations of coronary blood flow and reserve with aging in Fischer 344 rats,” Am. J. Physiol. Heart Circ. Physiol. 256, 66–73 (1989). [DOI] [PubMed] [Google Scholar]
- Hauptman J. G., DeJong G. K., Blasko K. A., and Chaudry I. H., “Measurement of hepatocellular function, cardiac output, effective blood volume, and oxygen saturation in rats,” Am. J. Physiol. Regulatory Integrative Comp. Physiol. 257, 439–444 (1989). [DOI] [PubMed] [Google Scholar]
- Ishise S., Pegram B. L., Yamamoto J., Kitamura Y., and Frohlich E. D., “Reference sample microsphere method: Cardiac output and blood flows in conscious rat,” Am. J. Physiol. Heart Circ. Physiol. 239, 443–449 (1980). [DOI] [PubMed] [Google Scholar]
- Kuwahira I., Gonzalez N. C., Heisler N., and Piiper J., “Changes in regional blood flow distribution and oxygen supply during hypoxia in conscious rats,” J. Appl. Physiol. 74, 211–214 (1993). [DOI] [PubMed] [Google Scholar]
- Malik A. B., Kaplan J. E., and Saba T. M., “Reference sample method for cardiac output and regional blood flow determinations in the rat,” J. Appl. Physiol. 40, 472–475 (1976). [DOI] [PubMed] [Google Scholar]
- Mistry N., Pollaro J., Song J., Lin M., and Johnson G. A., “Pulmonary perfusion imaging in the rodent lung using dynamic contrast enhanced MRI,” Magn. Reson. Med. 59, 289–297 (2008). 10.1002/mrm.21353 [DOI] [PMC free article] [PubMed] [Google Scholar]
- Oosting J., Struijker-Boudier H. A. J., and Janssen B. J. A., “Circadian and ultradian control of cardiac output in spontaneous hypertension in rats,” Am. J. Physiol. Heart Circ. Physiol. 273, 66–75 (1997). [DOI] [PubMed] [Google Scholar]
- Sasaki Y. and H. N.Wagner, Jr., “Measurement of the distribution of cardiac output in unanesthetized rats,” J. Appl. Physiol. 30, 879–884 (1971). [DOI] [PubMed] [Google Scholar]
- Steenstrup S., Hove J. D., Kofoed K., and Kelbæk H., “A maximum entropy method to compute the 13NH3 pulmonary transit time from right to left ventricle in cardiac PET studies,” Physiol. Meas. 23, 23–32 (2002). 10.1088/0967-3334/23/1/303 [DOI] [PubMed] [Google Scholar]
- Tuma R. F., Irion G. L., Vasthare U. S., and Heinel L. A., “Age-related changes in regional blood flow in the rat,” Am. J. Physiol. Heart Circ. Physiol. 249, H485–H491 (1985). [DOI] [PubMed] [Google Scholar]
- Veelken R., Danckwart L., Rohmeiss P., and Unger T., “Effects of intravenous AVP on cardiac output, mesenteric hemodynamics, and splanchnic nerve activity,” Am. J. Physiol. Heart Circ. Physiol. 257, 658–664 (1989). [DOI] [PubMed] [Google Scholar]
- Eastwood J. D., Lev M. H., Azhari T., Lee T. -Y., Barboriak D. P., Delong D. M., Fitzek C., Herzau M., Wintermark M., Meuli R., Brazier D., and Provenzale J. M., “CT perfusion scanning with deconvolution analysis: Pilot study in patients with acute middle cerebral artery stroke,” Radiology 222, 227–236 (2002). 10.1148/radiol.2221010471 [DOI] [PubMed] [Google Scholar]
- Cenic A., Nabavi D. G., Craen R. A., Gelb A. W., and Lee T. -Y., “Dynamic CT measurement of cerebral blood flow: A validation study,” AJNR Am. J. Neuroradiol. 20, 63–73 (1999). [PubMed] [Google Scholar]
- Nabavi D. G., Cenic A., Henderson S., Gelb A. W., Lee T. -Y., and Rosenberg G. A., “Perfusion mapping using computed tomography allows accurate prediction of cerebral infarction in experimental brain ischemia,” Stroke 32, 175–183 (2001). [DOI] [PubMed] [Google Scholar]
- Cremillieux Y., Berthezene Y., Humblot H., Viallon M., Canet E., Bourgeois M., Albert T., Heil W., and Briguet A., “A combined 1H perfusion∕3He ventilation NMR study in rat lungs,” Magn. Reson. Med. 41, 645–648 (1999). [DOI] [PubMed] [Google Scholar]
- Berthezene Y., Vexler V., Clement O., Muhler A., Moseley M. E., and Brasch R. C., “Contrast-enhanced MR imaging of the lung: assessments of ventilation and perfusion,” Radiology 183, 667–672 (1992). [DOI] [PubMed] [Google Scholar]
- Shpilfoygel S. D., Close R. A., Valentino D. J., and Duckwiler G. R., “X-ray videodensitometric methods for blood flow and velocity measurement: A critical review of literature,” Med. Phys. 27, 2008–2023 (2000). 10.1118/1.1288669 [DOI] [PubMed] [Google Scholar]
- Mistretta C., Ort M., Cameron J., Crummy A., and Moran P., “Multiple image subtraction technique for enhancing low contrast periodic objects,” Invest. Radiol. 8, 43–49 (1973). [DOI] [PubMed] [Google Scholar]
- Badea C. T., Hedlund L. W., Lin M., Boslego Mackel J. F., and Johnson G. A., “Tumor imaging in small animals with a combined micro-CT∕micro-DSA system using iodinated conventional and blood pool contrast agents,” Contrast Media Mol. Imaging 1, 153–164 (2006). 10.1002/cmmi.103 [DOI] [PubMed] [Google Scholar]
- Badea C. T., Hedlund L. W., Lin M., Boslego Mackel J. S., Samei E., and Johnson G. A., “Tomographic digital subtraction angiography for lung perfusion estimation in rodents,” Med. Phys. 34, 1546–1555 (2007). 10.1118/1.2717384 [DOI] [PMC free article] [PubMed] [Google Scholar]
- Lin M., Ning L., Badea C. T., Mistry N. N., Qi Y., and Johnson G. A., “A high precision contrast injector for small animal x-ray digital subtraction angiography,” IEEE Trans. Biomed. Eng. 55, 1082–1091 (2008). 10.1109/TBME.2007.909541 [DOI] [PMC free article] [PubMed] [Google Scholar]
- Lin M., Samei E., Badea C. T., Yoshizumi T. T., and Johnson G. A., “Optimized radiographic spectra for small animal digital subtraction angiography,” Med. Phys. 33, 4249–4257 (2006). 10.1118/1.2356646 [DOI] [PubMed] [Google Scholar]
- Ostergaard L., Weisskoff R. M., Chesler D. A., Gyldensted C., and Rosen B. R., “High resolution measurement of cerebral blood flow using intravascular tracer bolus passages. Part I: Mathematical approach and statistical analysis,” Magn. Reson. Med. 36, 715–725 (1996). 10.1002/mrm.1910360510 [DOI] [PubMed] [Google Scholar]
- Hoeper M., Maier R., Tongers J., Niedermeyer J., Hohlfeld J. M., Hamm M., and Fabel H., “Determination of cardiac output by the Fick method, thermodilution, and acetylene rebreathing in pulmonary hypertension,” Am. J. Respir. Crit. Care Med. 160, 535–541 (1999). [DOI] [PubMed] [Google Scholar]
- Kissling G., Ross C., and Brandle M., “Validity of thermal dilution technique for measurement of cardiac output in rats,” Am. J. Physiol. Heart Circ. Physiol. 265, 1007–1013 (1993). [DOI] [PubMed] [Google Scholar]
- Bowdle T. A., Freund P. R., and Rooke G. A., Cardiac Output (SpaceLabs Inc., Redmund, WA, 1991). [Google Scholar]
- Brown B. H., Smallwood R. H., Barber D. C., Lawford P. V., and Hose D. R., Medical Physics and Biomedical Engineering, Medical Science Series (Institute of Physics, Philadelphia, 1999). [Google Scholar]
- Jones N. L., Clinical Exercise Testing, 4th ed. (Saunders, Philadelphia, PA, 1997). [Google Scholar]
- Webster J. G., Medical Instrumentation Application and Design, 3rd ed. (Wiley, New York, 1998). [Google Scholar]
- Darovic G. O., Hemodynamic Monitoring, Invasive and Noninvasive Clinical Application, 3rd ed. (Saunders, Philadelphia, 1995). [Google Scholar]
- Badea C. T., Hedlund L. W., and Johnson G. A., “Micro-CT with respiratory and cardiac gating,” Med. Phys. 31, 3324–3329 (2004). 10.1118/1.1812604 [DOI] [PMC free article] [PubMed] [Google Scholar]
- Mai W., Badea C. T., Wheeler C. T., Hedlund L. W., and Johnson G. A., “Effects of breathing and cardiac motion on the spatial resolution in microscopic imaging of rodents,” Magn. Reson. Med. 53, 858–865 (2005). 10.1002/mrm.20400 [DOI] [PubMed] [Google Scholar]
- Mukundan S. J., Ghaghada K. B., Badea C. T., Kao C. -Y., Hedlund L. W., Provenzale J. M., Johnson G. A., Chen E., Bellamkonda R. V., and Annapragada A., “A liposomal nanoscale contrast agent for preclinical CT in mice,” AJR, Am. J. Roentgenol. 186, 300–307 (2006). 10.2214/AJR.05.0523 [DOI] [PubMed] [Google Scholar]
- Bronikowski T. A., Dawson C. A., and Linehan J. H., “Model-free deconvolution techniques for estimating vascular transport functions,” Int. J. Bio-Med. Comput. 14, 411–429 (1983). 10.1016/0020-7101(83)90024-7 [DOI] [PubMed] [Google Scholar]
- Sourbron S., Luypaert R., Morhard D., Seelos K., Reiser M., and Peller M., “Deconvolution of bolus-tracking data: A comparison of discretization methods,” Phys. Med. Biol. 52, 6761–6778 (2007). 10.1088/0031-9155/52/22/014 [DOI] [PubMed] [Google Scholar]
- Gamel J., Rousseau W. F., Katholi C. R., and Messel E., “Pitfalls in digital computation of the impulse response of vascular beds from indicator dilution curves,” Circ. Res. 32, 516–523 (1973). [DOI] [PubMed] [Google Scholar]
- Calamante F., Gadian D. G., and Connelly A., “Delay and dispersion effects in dynamic susceptibility contrast MRI: Simulations using singular value decomposition,” Magn. Reson. Med. 44, 466–473 (2000). [DOI] [PubMed] [Google Scholar]
- Calamante F., Willats L., Gadian D. G., and Connelly A., “Bolus delay and dispersion in perfusion MRI: Implications for tissue predictor models in stroke,” Magn. Reson. Med. 55, 1180–1185 (2006). 10.1002/mrm.20873 [DOI] [PubMed] [Google Scholar]
- Calamante F., Yim P. J., and Cebral J. R., “Estimation of bolus dispersion effects in perfusion MRI using image-based computational fluid dynamics,” Neuroimage 19, 341–353 (2003). 10.1016/S1053-8119(03)00090-9 [DOI] [PubMed] [Google Scholar]
- Balter S., Ergun D., Tscholl E., Buchmann F., and Verhoeven L., “Digital subtraction angiography: Fundamental noise characteristics,” Radiology 152, 195–198 (1984). [DOI] [PubMed] [Google Scholar]
- Clough A. V., Krenz G. S., Owens M., Al-Tinawi A., Dawson C. A., and Linehan J. H., “An algorithm for angiographic estimation of blood vessel diameter,” J. Appl. Physiol. 71, 2050–2058 (1991). [DOI] [PubMed] [Google Scholar]
- Zierler K. L., “Equations for measuring blood flow by external monitoring of radioisotopes,” Circ. Res. 16, 309–321 (1965). [DOI] [PubMed] [Google Scholar]
- Wirestam R., Ryding E., Lindgren A., Geijer B., Holtås S., and Ståhlberg F., “Absolute cerebral blood flow measured by dynamic susceptibility contrast MRI: A direct comparison with Xe-133 SPECT,” Magn. Reson. Mater. Phys., Biol., Med. 11, 96–103 (2000). 10.1016/S1352-8661(00)00091-0 [DOI] [PubMed] [Google Scholar]
- Hoffmann K. R., Nazareth D. P., Miskolczi L., Gopal A., Wang Z., Rudin S., and Bednarek D. R., “Vessel size measurements in angiograms: A comparison of techniques,” Med. Phys. 29, 1622–1633 (2002). 10.1118/1.1488603 [DOI] [PubMed] [Google Scholar]
- Breu H., Gil J., Kirkpatrick D., and Werman M., “Linear time Euclidean distance algorithms,” IEEE Trans. Pattern Anal. Mach. Intell. 17, 529–533 (1995). 10.1109/34.391389 [DOI] [Google Scholar]
- Lam L., Lee S. W., and Suen C. Y., “Thinning methodologies—A comprehensive survey,” IEEE Trans. Pattern Anal. Mach. Intell. 14, 869–885 (1992). 10.1109/34.161346 [DOI] [Google Scholar]
- Bowles D. K., Farrar R. P., and Starnes J. W., “Exercise training improves cardiac function after ischemia in the isolated, working rat heart,” Am. J. Physiol. Heart Circ. Physiol. 263, 804–809 (1992). [DOI] [PubMed] [Google Scholar]
- Veal N., Moal F., Wang J., Vuillemin E., Oberti F., Roy E., Kaassis M., Trouve R., Saumet J. -L., and Cales P., “New method of cardiac output measurement using ultrasound velocity dilution in rats,” J. Appl. Physiol. 91, 1274–1282 (2001). [DOI] [PubMed] [Google Scholar]
- Popovic V. P. and Kent K. M., “120-day study of cardiac output in unanesthetized rats,” Am. J. Physiol. 207, 767–770 (1964). [DOI] [PubMed] [Google Scholar]
- Walsh G. M., Tsuchiya M., and Frohlich E. D., “Direct Fick application for measurement of cardiac output in rat,” J. Appl. Physiol. 40, 849–853 (1976). [DOI] [PubMed] [Google Scholar]


