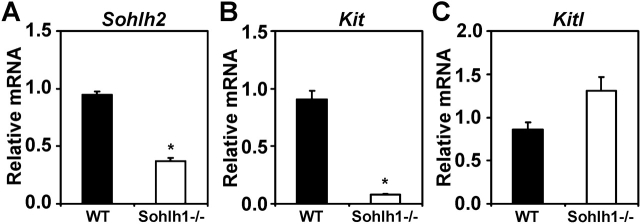
FIG. 6.
Sohlh2, Kit, and Kitl expression in Sohlh1-deficient ovaries. A–C) Results of real-time PCR are shown for relative mRNA expression of Sohlh2 (A), Kit (B), and Kitl (C) in WT and Sohlh1–/– ovaries. Data are normalized to Gapdh expression and are given as the mean relative quantity (compared with WT), with error bars representing the SEM. Student t-test was used to calculate P values. *, P < 0.001.

