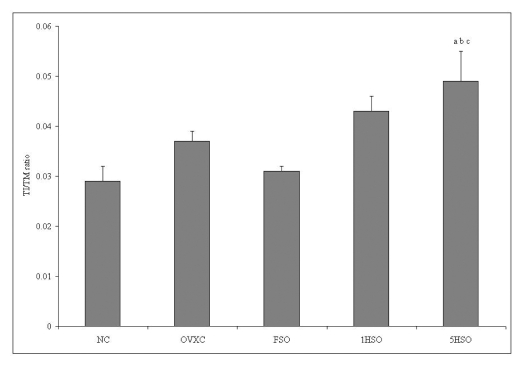
Figure 2.
Intima/media (TI/TM) ratio of rats according to treatment group. Results are mean ± SEM (n = 6). a = significant compared to the NC group (p < 0.05). b = significant compared to the OVXC group (p < 0.05). c = significant compared to the FSO group (p < 0.05). NC, normal control; OVXC, ovariectomized control; FSO, fresh soy oil-treated group; 1HSO, once-heated soy oil-treated group; 5HSO, five-times-heated soy oil-treated group.

