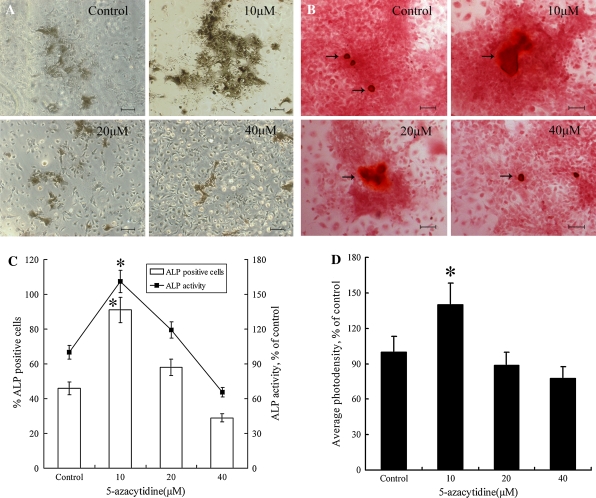
Fig. 2.
Analysis of ALP activity and mineralization of induced MSCs. MSCs were pretreated with different concentrations (0, 10, 20 or 40 μM) of 5-azacytidine for 24 h and analyzed at the 14th day after osteogenic induction. a Modified Gomori staining. b Analysis of mineralization by Alizarin red S staining. The black arrows indicate the mineralized nodules. c Quantitative analysis of ALP. The broken line represents the ALP activity in cell lysates and the columns represent the percentages of ALP staining positive cells. d Photodensity analysis of Alizarin red S staining. (*P ≤ 0.05). Scale bars are 50 μm

