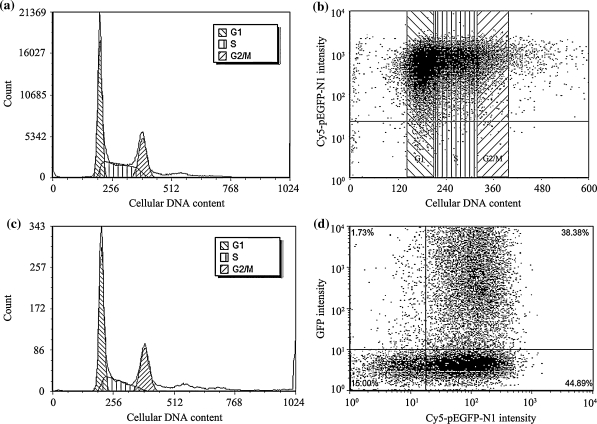
Fig. 4.
FACS analyses of 293-F cells after transfection with PEI/Cy5-pEGFP-N1 complexes (10 min preparation, N/P ratio 46) for 4 h without post-transfection culture (a–c) and with post-transfection culture of 20 h (d). a Cell cycle frequency distribution of the total population; b Cy5-pEGFP-N1 level in cells in different phases of cell cycle among the total population; c cell cycle frequency distribution of GFP positive cells in the total population; d dot plots of GFP intensity against Cy5 intensity displayed by all cell population. Non-transfected cells were used as controls

