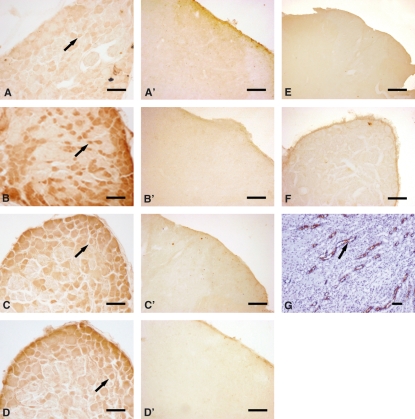
Fig. 2.
Immunohistochemical analysis: AQP2 expression in the DRG (A) and spinal cord (A′) of naïve rats and in DRG (B) and spinal cord (B′) of CCI rats; AQP1 expression in the DRG (C) and spinal cord (C′) of naïve rat and in DRG (D) and spinal cord (D′) of CCI rats. Negative controls were shown in (E,F). Positive control (kidney) was shown in (G). Arrows indicate positive staining. Scale bar = 100 μm.

