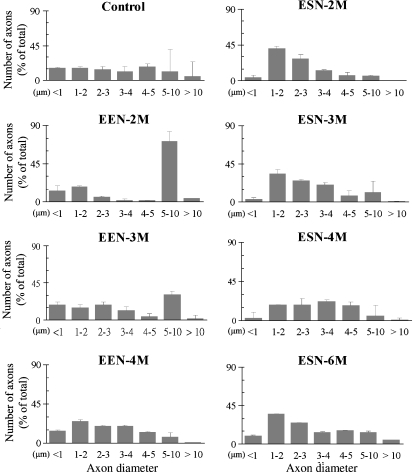
Fig. 5.
Distribution of axons in the recipient nerve at different stages following neurorrhaphy. Data from control and different EEN and ESN survival animals are illustrated as labeled. Axons were grouped arbitrarily based on their diameters into different categories as shown in the abscissa. Data are mean ± SD.

