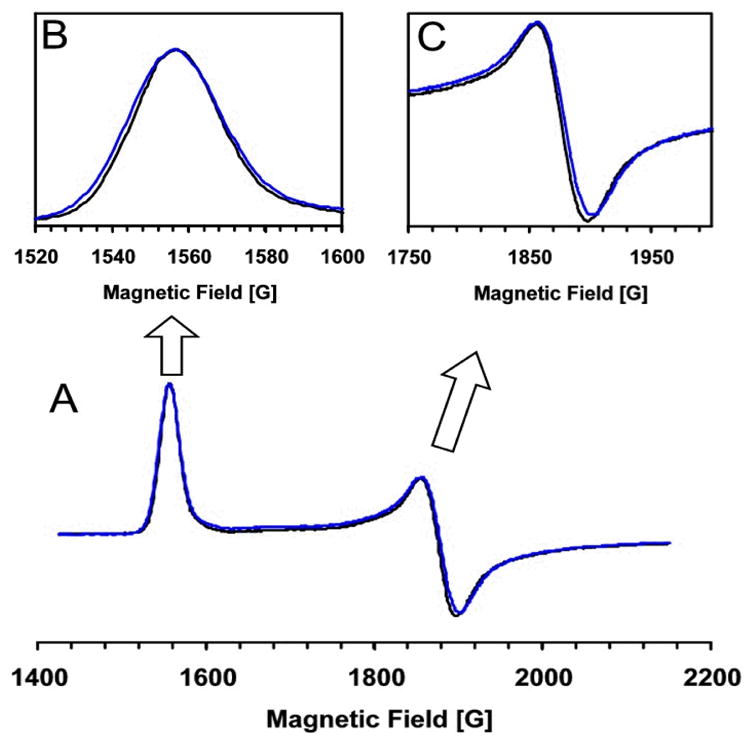
Figure 5.

EPR Spectra of Fe(II)-HppE nitrosyl complex with (R)-[17OH]HPP (12-R). Panel A: full low field region of the spectrum; Panel B: detailed view of the g = 4.42 region; Panel C; detailed view of the g = 3.63 region. Black lines: (R)-[16OH]HPP; Blue lines: (R)-[17OH]HPP. Instrumental parameters are the same as shown in Figure 3.
