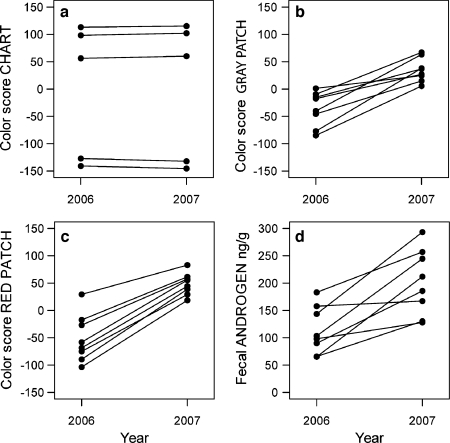
Fig. 3.
Individual variation in hair coloration and androgen level between years. Lines link repeated measures of the same individual in different years. a Color scores of color chart standard patches did not differ between years. b Color scores of gray control patches were significantly higher in 2007. c Color scores of red patches increased significantly between years, and effect size explaining the difference between red patches between years was greater than that explaining the difference between gray patches between years. d Androgen levels were significantly increased in 2007 versus 2006.

