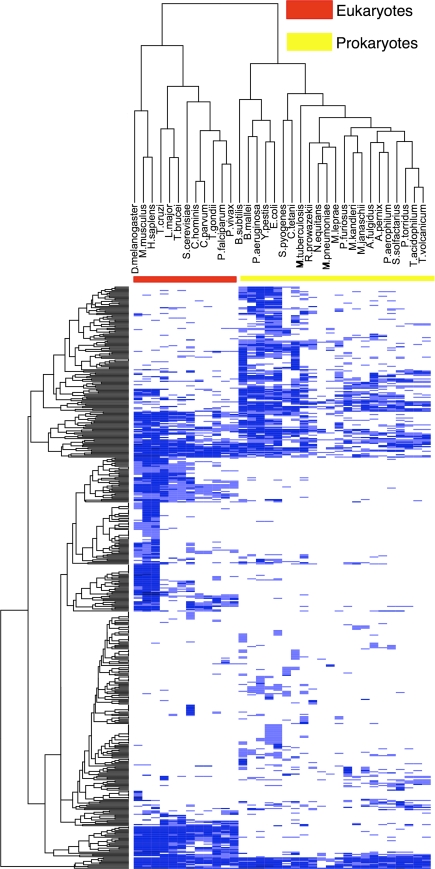
Fig. 2.
PFAM membrane protein families in 34 organisms. Organism names are listed horizontally at the top (columns). 476 Pfam membrane protein families are on the vertical axis (rows). Colors indicate binning for the number of times a particular family appears in an organism. White indicates a particular family is not found in an organism; light blue means the family appears once; medium blue, between two and 49 times; and dark blue means the family is found 50 or more times. The red and yellow bars show the clustering of eukaryotes and prokaryotes, respectively. The heatmap was constructed using the R function “heatmap.2” with hierarchical clustering and default parameters [37]

