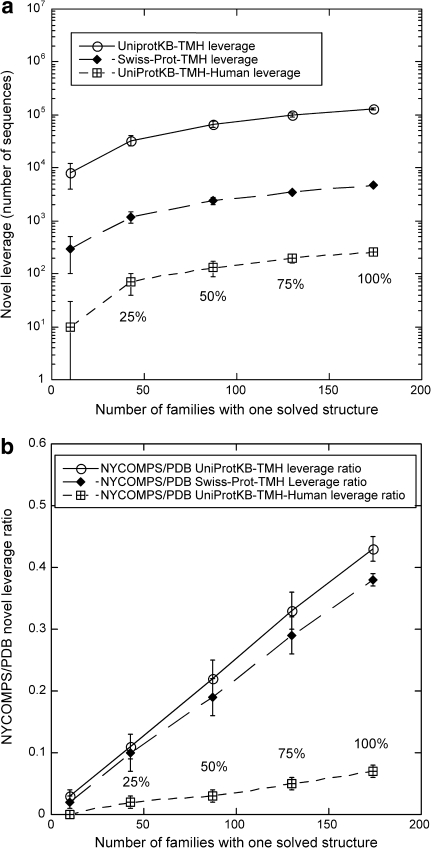
Fig. 4.
Potential novel αIMP leverage provided by NYCOMPS targets. a The x-axis gives the number of seed families for which we hypothetically determine a structure (corresponding to 10 seed families or to 25–100% of all seed families; e.g. 25% corresponds to 43 seed families and 100% to 174 seed families); the y-axis reports the number of predicted αIMPs with more than 2 TMHs for which more than 50% of the residues in the TM region could be modeled using the NYCOMPS targets on the x-axis as templates (leverage). Numbers on the y-axis are for proteins in: UniProtKB-TMH (i.e. all predicted αIMPs in UniProtKB with more than 2 TMHs, see “Methods”; blank circles and continuous line), Swiss-Prot-TMH (filled diamonds and long-dash line) and UniProtKB-TMH-Human (i.e. human proteins in UniProtKB-TMH, crossed squares and short-dash line). Error bars are obtained by bootstrapping [48] (“Methods”). b Comparison between NYCOMPS target and PDB protein leverage. On the y-axis we report the ratio between the respective leverage values. Notations are as in (a). See “Methods” for the way UniProtKB-TMH leverage by PDB proteins is calculated

